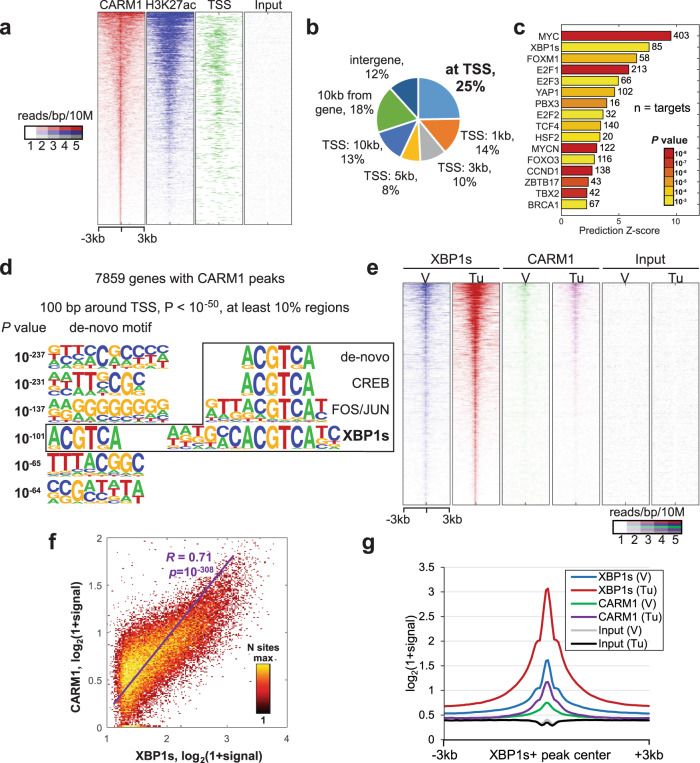
Fig. 1. CARM1-binding sites are enriched for XBP1s consensus.
a Heatmap of cut-and-run profiles of CARM1, H3K27ac, and input signal. Binding sites are sorted by strength of CARM1 signal. 3 kb around CARM1 peak centers are shown with 100 60 bp bins. b Genomic-wide distribution of CARM1 peaks relative to gene. c Ingenuity Pathway analysis of known regulators enriched among 7859 genes bound by CARM1. Transcriptional regulators with activation prediction Z-score of at least 2 and P < 0.001 are shown. The P value in Ingenuity Pathway analysis measures whether there is a statistically significant overlap between dataset genes and the genes that are regulated by a regulator. It is calculated using two-tailed Fisher’s Exact Test. d De novo motif analysis of 100 bp TSS regions for 7859 genes bound by CARM1. e Heatmap of cut-and-run profiles of XBP1s, CARM1, and input signal for vehicle (V) or ER stress-inducer tunicamycin (Tu)-treated cells around center of XBP1s peaks. Binding sites are sorted by strength of XBP1s signal. 3 kb around XBP1 peak centers are shown with 100 60 bp bins. f Correlation of XBP1s and CARM1 binding signal in XBP1s peak regions in tunicamycin-treated cells. P value was calculated using two-tailed test of significance. g Average profiles of binding signals for the indicated samples as shown in f.

