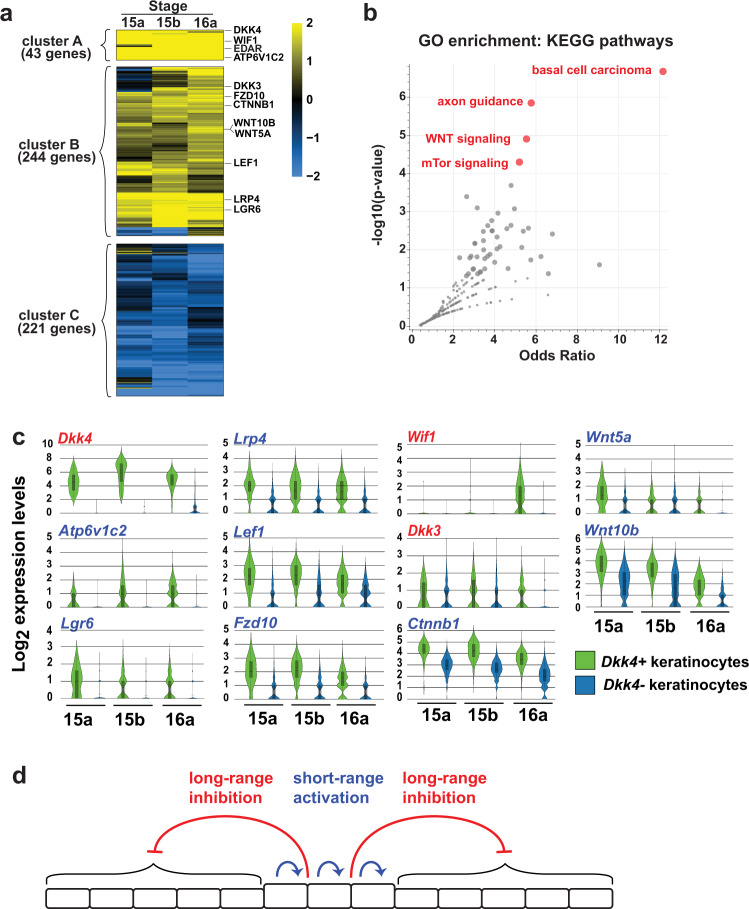
Fig. 3. Patterns of differential gene expression and gene ontology analysis in basal keratinocyte subpopulations.
a Heatmap of gene expression difference (log2 fold-change) in Dkk4-positive compared to Dkk4-negative keratinocytes. b Ontology analysis for genes that are highly (cluster A) or moderately (cluster B) upregulated identifies four KEGG pathways that are significantly enriched in Dkk4-positive cells. c Expression levels for Wnt pathway genes depicted as violin plots. Embedded box and whisker plots depict population maxima and minima (whiskers), first and third quartile boundaries (boxes), mean (solid lines), and median (broken lines). Approach to the analysis of differential expression (a) and ontology (b) and assessment of individual gene expression levels (c) are described in the text. d A reaction−diffusion model for color pattern establishment in the basal epidermis where Wnt pathway components participate in both short-range activation and long-range inhibition.

