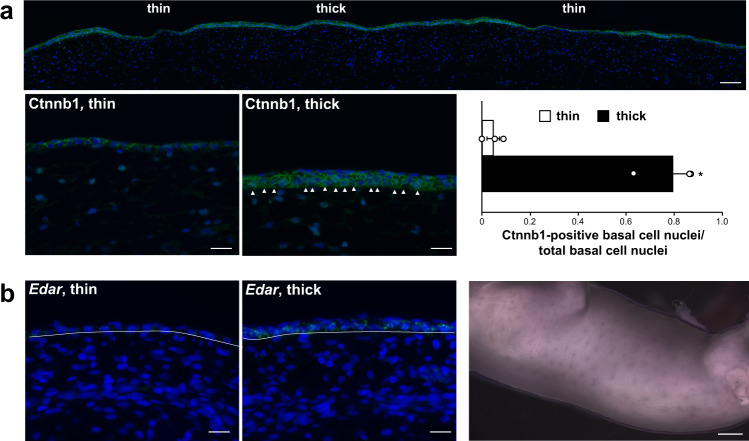
Fig. 4. Ctnnb1 immunostaining and Edar expression in embryonic cat skin.
a Ctnnb1 immunofluorescence staining (green) in thin and thick epidermal domains from sections of Stage 16a embryonic cat skin (DAPI, blue). White arrow heads mark Ctnnb1-positive basal cell cytoplasm and/or nuclei. The bar graph shows the fraction of Ctnnb1-positive basal cells (of a total number of basal cells; mean +/− sem) in thin and thick domains (n = 3 Stage 16a embryos, basal cells from three thick and three thin regions from each embryo were evaluated; two-tailed t-test, *P = 0.006). b Edar expression (green) in thin and thick epidermis from sections of a stage 16a embryo (similar results from Stage 16a (n = 2) and Stage 16b (n = 3) embryos; DAPI, blue) and Edar expression (purple) in a Stage 16b embryo (n = 1). Scale bars: a (top), 100 μM; a (lower left and middle), 25 μM; b (left, middle), 25 μM; b (right), 1.5 mm.

