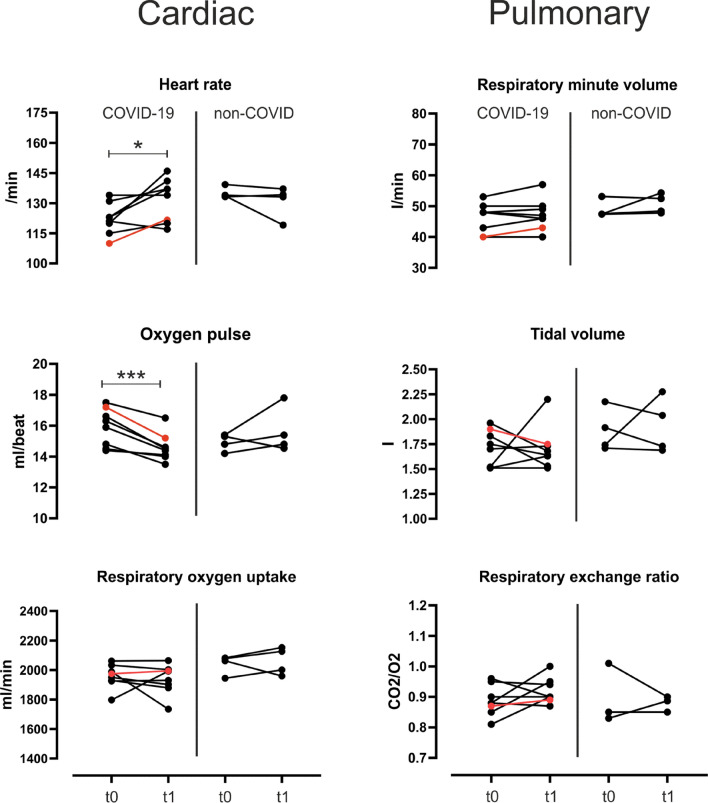
Figure 3.
Mean values of cardiac and pulmonary parameters under moderate intensity in a CPET (100–200 Watt) in athletes with or without a history of SARS-CoV-2 infection. t0: Routine CPET during preparation phase in summer 2020 t1: post-SARS-CoV-2 infection (COVID-19) in winter 2020 or during other cardiac outpatient diagnostics in winter 2020 (non-COVID). The athlete with the highest T1-mapping values in magnetic resonance imaging and with pericardial effusion during the infection is highlighted in red. *: p < 0.05; ***: p < 0.001.

