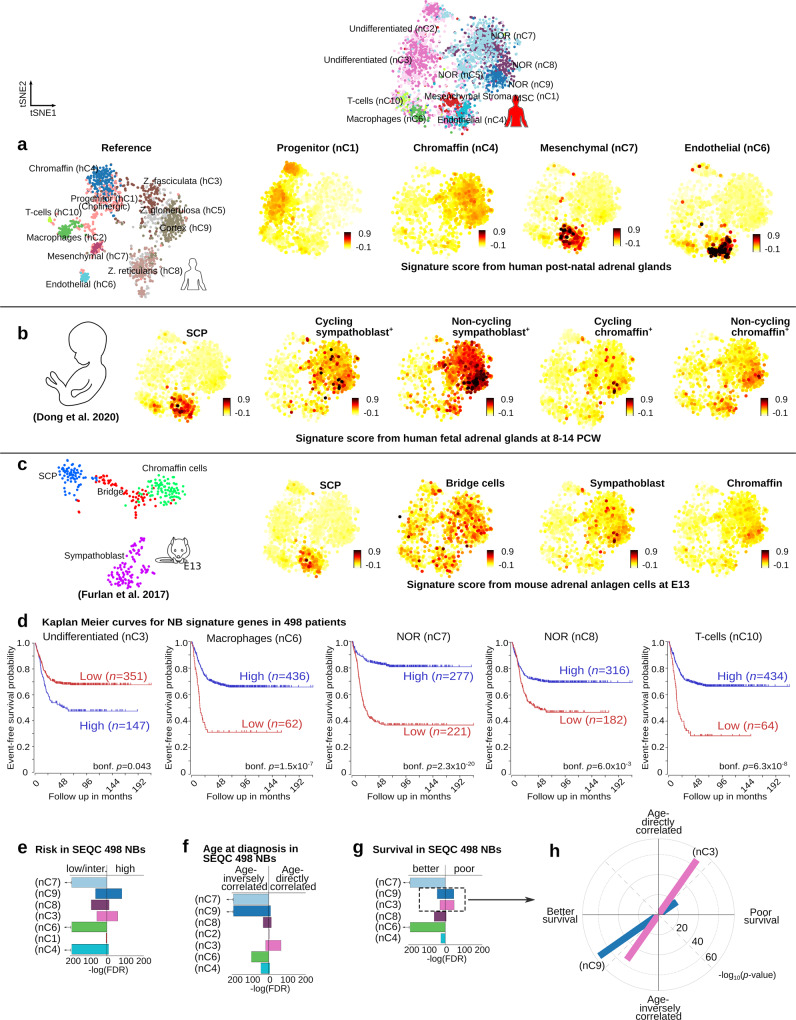
Fig. 6. Cell clusters from neuroblastoma and developing human and mouse adrenal glands share distinct expression signatures, and their expression is associated with patient survival and age at diagnosis.
tSNE of neuroblastoma clusters illustrating the signature score of genes (as detailed in “Methods”) characterizing a human postnatal, b embryonic14 adrenal glands, and c mouse embryonic adrenal anlagen (E13) cell clusters6. The bars next to the tSNEs in a, b, and c illustrate the scale of the signature score. A greater signature score indicates a larger transcriptional resemblance to the cluster of interest. SCP refers to the cluster of mouse multipotent Schwann cell precursors at E13; and Bridge refers to the cell cluster that defines transiting cells from SCP toward the chromaffin population at E13. d Kaplan–Meier curves for neuroblastoma clusters with significant differences (Bonferroni-corrected [bonf. p], log-rank tests in survival for 498 SEQC neuroblastoma patients with a low (red) and high (blue) signature gene expression17. e–g Using a gene enrichment-based approach (Benjamini–Hochberg corrected, Fisher’s exact tests), the specific signature genes for the noradrenergic nC7, nC8, and nC9, endothelial nC4, macrophages nC6, and undifferentiated nC3 clusters were found to be significantly upregulated in low- and intermediate (inter.)-risk patients and also in individuals with better survival. In contrast, the signature genes of noradrenergic nC9 and undifferentiated nC3 clusters presented a significantly enrichment in patients with high-risk and poor survival. The signature genes of the undifferentiated nC3 cluster presented also a remarkable significant correlation with age at diagnosis. h Signature genes associated with poor survival for noradrenergic nC9 and undifferentiated nC3 clusters are significantly correlated with age at diagnosis, and oppositely those associated with better survival are inversely correlated with age. Genes are included in Supplementary Data 9. A solid arrow next to the bar indicates a FDR < 1 × 10−50. Colors of bars displayed in (e), (f), (g), and (h) represent the neuroblastoma cell clusters by color in (a).

