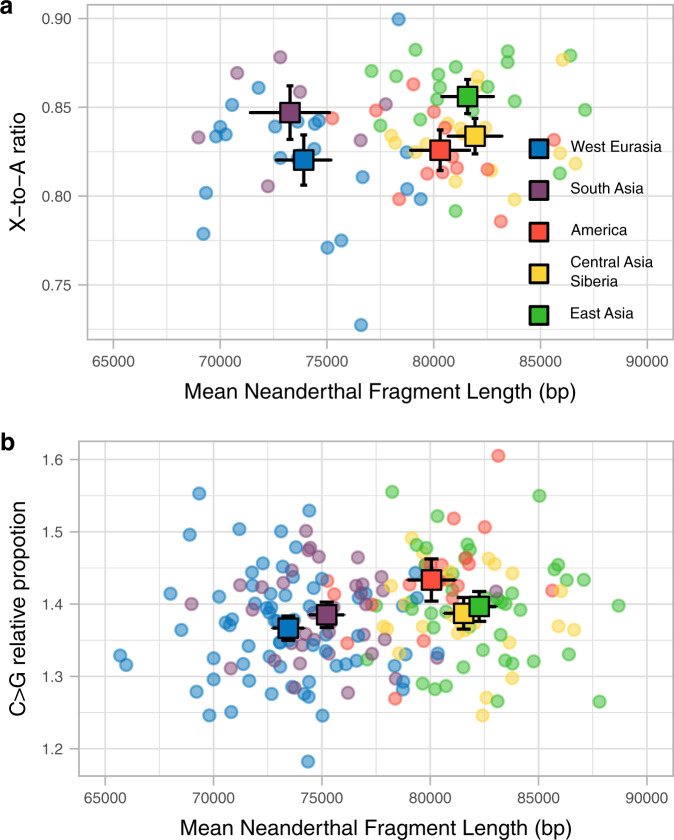
Fig. 4. Sex-specific mutation patterns.
a Scatterplot of the X-to-A ratio in derived allele accumulation (y-axis, Methods) and the mean archaic fragment length (x-axis) for each region (colour coded). Each dot represents an individual in the corresponding population. The mean for each population for each axis is shown in squares and their 95%CI are denoted by the error bars. Only females were used to produce this plot. The sample sizes of individuals for each region for which summary statistics are derived, together with other statistics, are indicated in Supplementary Table 12. b The same as in (a), but the ratio between the proportions of C > G derived alleles in cDNM and the rest of the genome (Methods). All samples were used to produce this plot. The sample sizes of individuals for each region for which summary statistics are derived from, together with other statistics, are indicated in Supplementary Table 2 and Supplementary Table 10.

