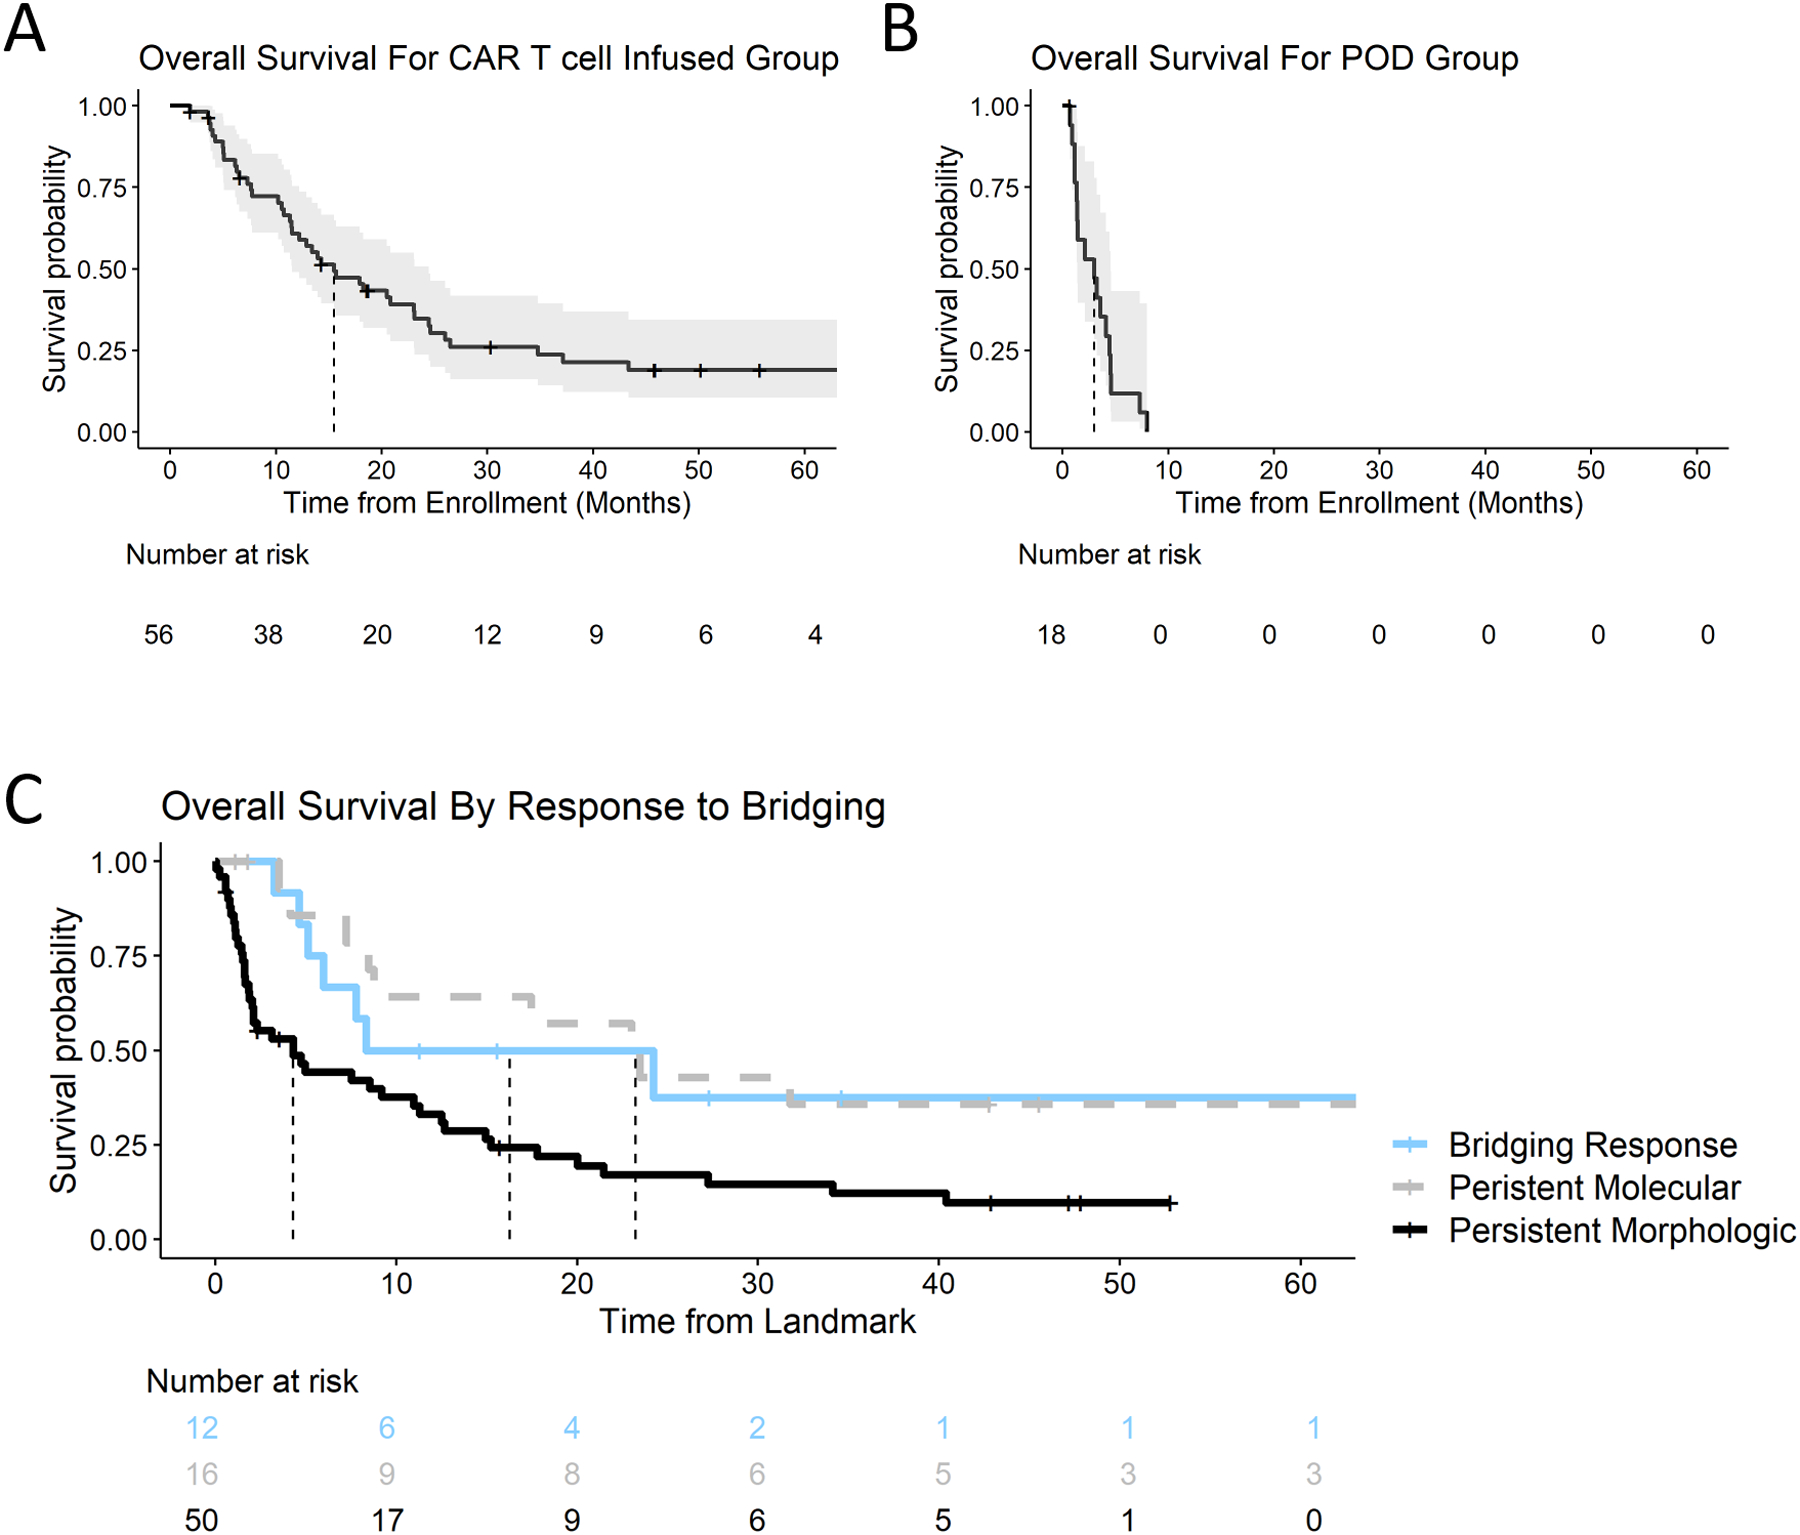
Figure 1:

Overall survival from enrollment (start of bridging) for the (A) CAR T cell infused patients and (B) patients who were not infused due to POD. Dashed line – median overall survival. Due to immortal time arising from POD patient death during the bridging period, survival curves are not compared directly. POD: progression of disease. (C) Response to bridging at 3-month post-enrollment landmark as stratified by treatment group. Response categories are defined in text. Axis displayed as percent of patients in group, while numbers in box are absolute numbers of patients in group. p < 0.001 by Fisher’s exact test.
