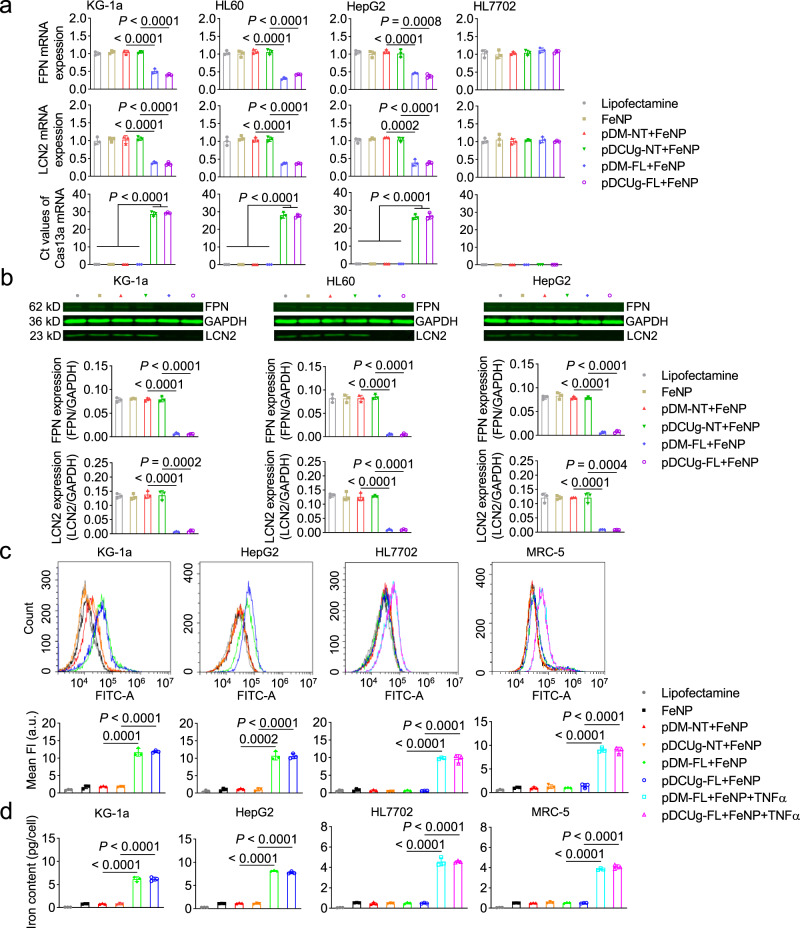
Fig. 3. Gene expression, ROS production, and iron content in the GIFT-treated cells.
Cells were transfected by plasmid vectors and cultured for 24 h, and then incubated with or without 50 μg/mL of FeNP. Gene expression, ROS production, and iron content of cells were detected at 48 h post FeNP administration. a QPCR analysis of mRNA expression. b Western blot assay of protein expression. Samples were run on the same blot. The representative image and quantified optical density are shown. c Measurement of ROS levels. The fluorescence shift and quantified fluorescence intensity are shown. a.u., arbitrary units. d Measurement of iron content. c, d only show the data of four cell lines (KG1a, HepG2, HL7702, and MRC5). The representative images of flow cytometry detection of ROS are shown in Supplementary Fig. 33. The detection results of ROS and iron content of other two cells (HL60 and WEHI-1) are shown in Supplementary Fig. 34. c, d use a same set of symbols. Data are presented as mean ± SD (n = 3 biologically independent samples) and analyzed by one-way ANOVA with Tukey’s test.

