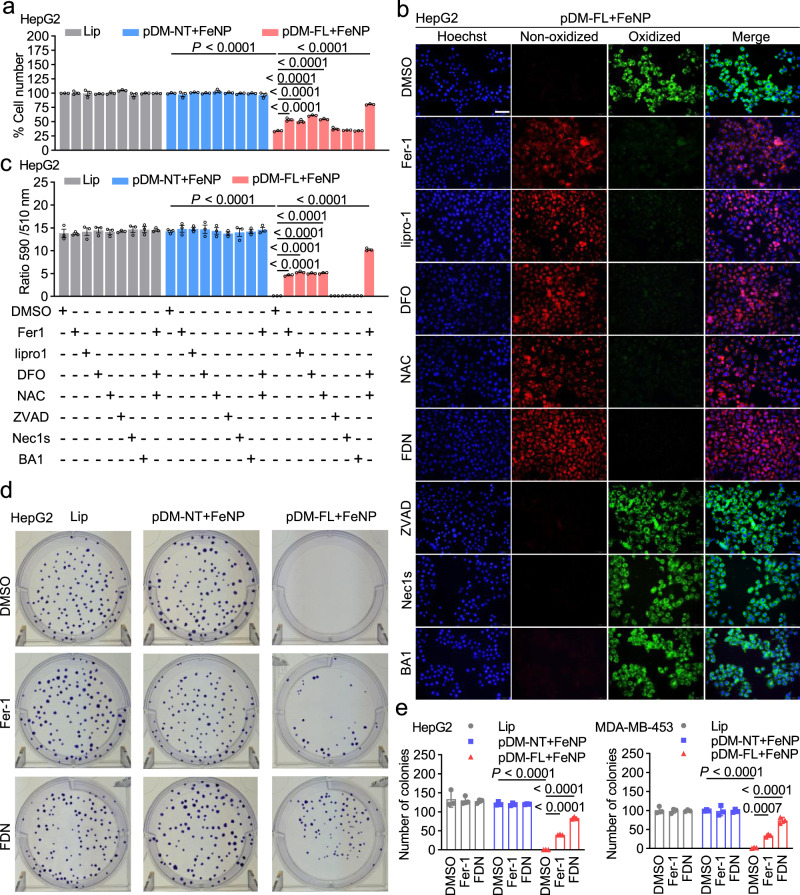
Fig. 4. GIFT-induced cell death by ferroptosis.
Cells were transfected with various plasmids and cultured for 24 h. The cells were then co-incubated with FeNP and indicated inhibitors for 48 h. a Cell viability. The cell viability was detected by the Cell-Titer-Glo 2.0 reagent (n = 3 biologically independent samples). Only the results of the HepG2 cell are shown here. The results of other seven cell lines are shown in Supplementary Fig. 35. b Lipid ROS imaging. Lipid ROS production was detected by C11-BODIPY and imaged by fluorescence microscope. Scale bars, 50 μm. Only the representative images of the HepG2 cell that were treated by pDM-FL + FeNP and various inhibitors are shown here. The representative images of all eight cell lines under all various treatments are shown in Supplementary Fig. 36–43. Blue, nucleus; red, reduced dye; green, oxidized dye. c Lipid ROS quantification. Images of cells analyzed by ImageJ software and the ratio of intensity in 590 to 510 channels were calculated (n = 3 independent micrographs). Only the results of the HepG2 cell are shown here. Those of other seven cell lines are shown in Supplementary Fig. 44. d, e Colony formation. d Representative images of the HepG2 cell. All images of four cell lines are shown in Supplementary Figs. 45 (HepG2 and MDA-MB-453) and 46 (CT-26 and PANC1). e The quantified data of colony formation assay of two cells (HepG2 and MDA-MB-453) (n = 3 biologically independent samples). The quantified data of colony formation assay of the other two cells (CT-26 and PANC1) are shown in Supplementary Fig. 46. Each treatment was conducted in triplicates. Lip Lipofectamine, Fer1 Ferrostatin-1 (1 µM), lipro1 liproxstatin-1 (1 µM), DFO deferoxamine (100 µM), NAC N-acetylcysteine (1 mM), ZVAD ZVAD-FMK (50 μM), Nec1s Necrostatin-1s (10 µM), BA1 Bafilomycin A1 (1 nM), FDN co-incubation of Fer1, DFO and NAC. Data are presented as mean ± SD and analyzed by one-way ANOVA with Tukey’s test.

