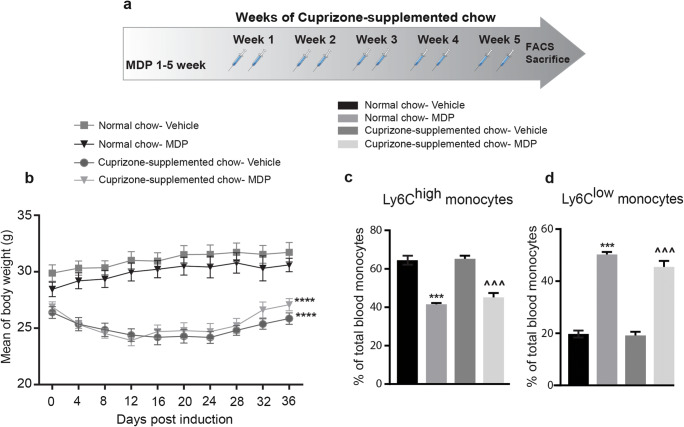
Fig. 1.
Systemic MDP administrations shift monocyte subsets towards Ly6Clow monocytes in the cuprizone model. (a) Representative of the timeline of weeks of cuprizone-supplemented chow and MDP administration. n = 5 mice/group used in treatment and control groups in normal food, and n = 10 mice/group used in treatment and control groups in cuprizone-supplemented diet. (b) Mean of body weight changes following treatment with vehicle or MDP in normal food and cuprizone-supplemented diet groups. Data are expressed as the means ± SEM; ****P < 0.0001, two-way ANOVA followed by Dunnett’s multiple comparisons test. (c) Percentage of blood inflammatory Ly6Chi monocytes following treatment in normal food and cuprizone-supplemented diet groups as measured by FACS. Data are expressed as the means ± SEM; ***P < or = 0.0001 versus normal chow–vehicle, ^^^P < or = 0.0001 versus cuprizone-supplemented chow–vehicle, one-way ANOVA with Tukey’s multiple comparisons test. (d) Percentage of blood Ly6Clow patrolling monocytes following treatment in the experimental groups. Data are expressed as the means ± SEM; ***P < or = 0.0001 versus normal chow–vehicle, ^^^P < or = 0.0001 versus cuprizone-supplemented chow–vehicle, one-way ANOVA with Tukey’s multiple comparisons test

