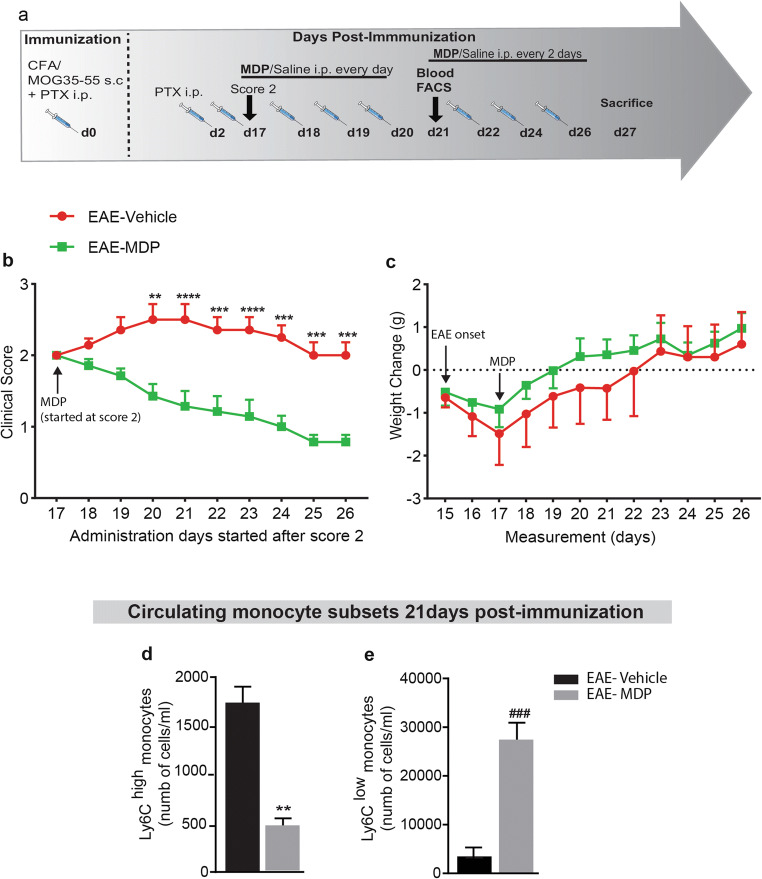
Fig. 6.
MDP administration after the onset of the disease prevented EAE progression in mice. (a) Representative timeline of the entire protocol, including inducing EAE, MDP administrations, and FACS analysis in mice treated with vehicle (n = 7) or treated with MDP (n = 7). (b) Clinical scores of mice were determined daily after all mice selected with score 2. Data are expressed as the means ± SEM; **P = 0.01, ***P < or = 0.0003, ****P < 0.0001, two-way ANOVA followed by Tukey’s multiple comparisons test. (c) Body weight changes measured after score 2 treatment in the treatment and control groups. Data are expressed as the means ± SEM. (d) and (e) Absolute count of blood Ly6Chi and Ly6Clow monocytes respectively following treatment with vehicle or MDP in EAE mice as measured by FACS 1-week after MDP injections (21 days after immunization). Data are expressed as the means ± SEM; **P < 0. 002 versus EAE–vehicle, ###P < 0.0002 versus EAE–vehicle, Student’s t test

