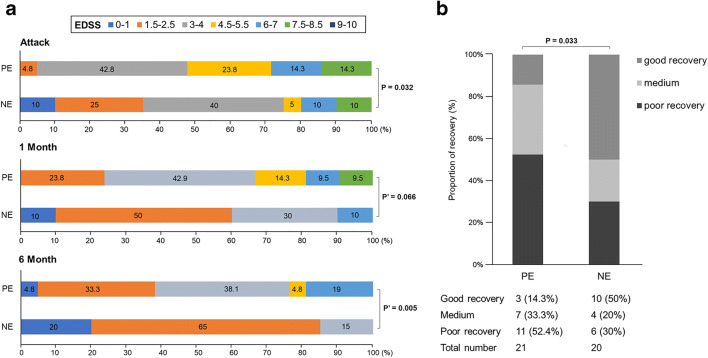
Fig. 3.
The changes of EDSS score in the PE and NE groups after follow-up. (A) Distribution of Expanded Disability Status Scale (EDSS) scores at attack, at 1 month and 6 months in both groups. (B) The improvement of EDSS score in the persistent enhancement group was worse than that in the no enhancement group at 6 months. p′ = adjusted p value.

