FIGURE 3.
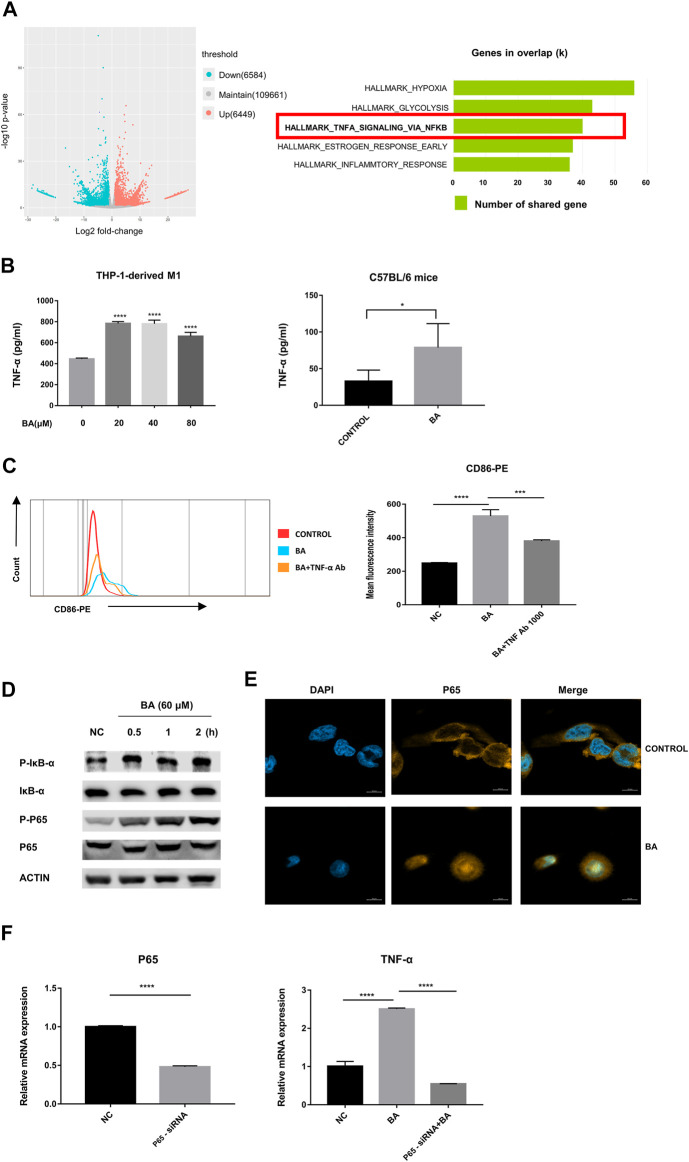
Baicalein promoted M1 macrophage polarization via NF-κB/TNF-α signaling pathways. (A) left, RNA-seq analysis was performed and the volcano plot was demonstrated. (A) right, results of Hallmark analysis on up-regulated genes in the baicalein group compared with that in the control group. (B) the levels of TNF-α in the supernatant of THP-1-derived M1 macrophage (left) and tumor tissues (right) were measured by ELISA. (C) TNF-α neutralizing antibody (1,000 ng/ml) was used to block TNF-α and the percentage of CD86-positive macrophages was detected by flow cytometry. (D) M1 macrophages derived from THP-1 were treated with baicalein (60 μM) for varying times as indicated. The cytoplasmic levels of p-IκB, IκB, P65, and p-P65 were measured by western blotting. After exposure to BA for 30 min, the expression levels of p-p65 and p-IκB increased, with higher levels being sustained until 120 min. (E) nuclear translocation of NF-κB P65 in THP-1-derived M1 macrophages was detected by fluorescent staining and confocal laser scanning microscopy. Cells were treated with baicalein (60 μM) for 4 h. The expression of P65 was labeled with a primary specific antibody and a subsequent Cy3-conjugated secondary antibody (yellow). The nucleus was stained by DAPI (blue). (F) P65 siRNA was used to knock down P65 in M1 macrophages. QRT-PCR was used to detect the efficiency of P65 knockdown (left) and the mRNA expression of TNF-α in transfected cells (right). All experiments were repeated three times independently. Data are presented as mean ± SD. *p < 0.05, ***p < 0.001, ****p < 0.0001, for comparison with control group. NS, no significance. BA = baicalein, NC = negative control.

