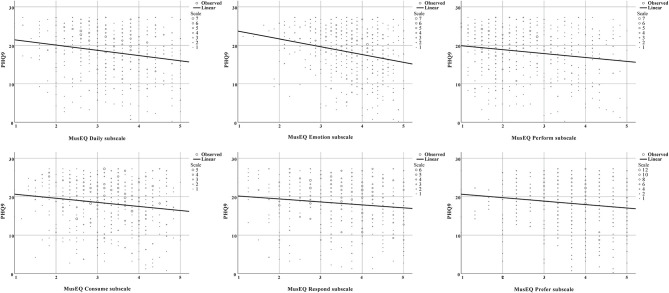
Figure 2.
Scatter plot depicting the relationship between the PHQ9 scale and the six MusEQ subscales. Data points in the upper half of each plot indicate participants who reported feeling less depression, whereas data points in the lower half of each plot indicate participants who reported feeling more depression. As per Table 4, a significant negative correlation was observed between the PHQ9 scale and each of these subscales.

