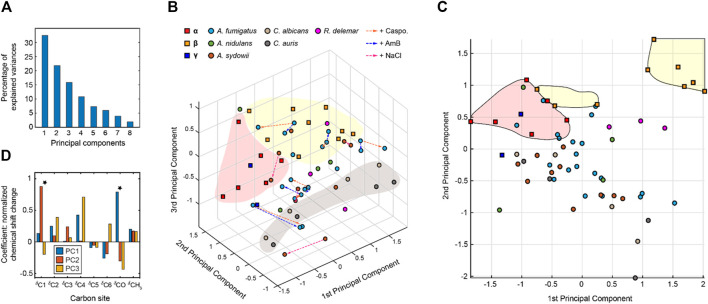
FIGURE 4.
Principal component analysis of chitin chemical shifts. (A) Variance explained by each principal component (PC). (B) PCA scores for chitin NMR chemical shifts projected onto principal component 1 (PC1) vs. PC2 vs. PC3. Model chitin allomorphs (α, β, and γ-types) are shown using squares while chitin forms identified in fungal cell walls are presented using circles. Shaded regions in red and yellow are used to enclose α- and β-type chitins, respectively. The shaded region in grey mainly contains data from Candida species. Data from different model samples and fungal species are color-coded. Arrows in orange, blue, and magenta represents the changes induced by caspofungin (Caspo.), the amphotericin B (AmB), and NaCl (from 0.5 to 2.0 M), respectively. (C) PCA scores of chitin chemical shifts projected onto PC1 and PC2 proving a better visualization of most chitin forms. (D) Loadings for each PC. Asterisks indicate the most pronounced differences for PC1 and PC2.

