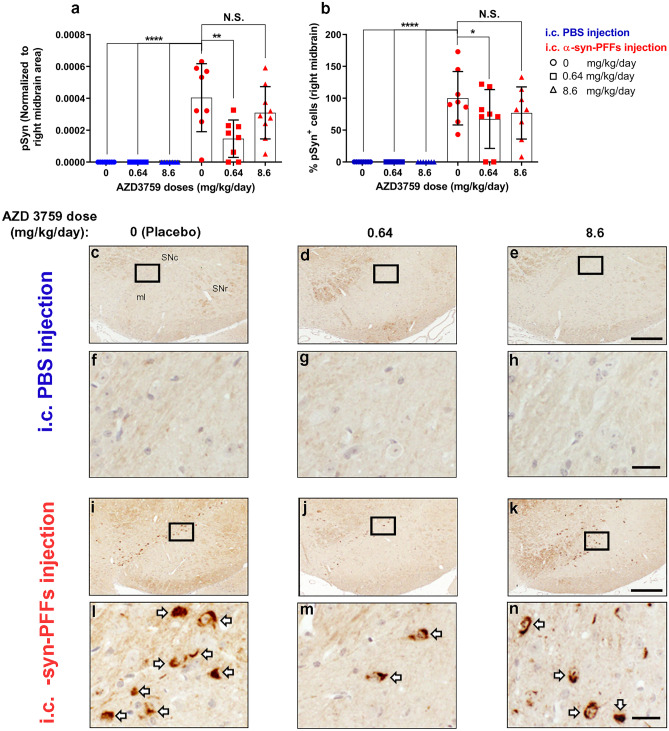
Fig. 5.
AZD3759 decreases α-syn propagation in wild-type mice at the level of right substantia nigra. a Histogram showing the total level of pSyn normalized to ipsilateral midbrain area. Statistical significance in a was determined by one-way ANOVA, followed by Tukey’s HSD post hoc test (F(5,40) = 15.48, ****P < 0.0001). b Histogram showing the % of pSyn+ cells ([number of pSyn+ cells/average of pSyn+ cells of the Placebo- α-syn-PFFs group)] × 100) at the level of the midbrain. Statistical significance in b was determined by one-way ANOVA, followed by Tukey’s HSD post hoc test (F(5,39) = 15.76, ****P < 0.0001). c–n pSyn immunostaining of coronal sections at the level of the substantia nigra in C57/B6C3F1 mice intracerebral injected with PBS (c–e) or α-syn-PFFs (average fibril length 30.30 nm) (i–k) and treated with 1% methylcellulose (Placebo, n = 8), 0.64 mg/kg/day of AZD3759 (n = 6 for PBS-injected mice and n = 8 for α-syn-PFFs-injected mice) and 8.6 mg/kg/day of AZD3759 (n = 7 for PBS-injected group and n = 9 for the α-syn-PFFs-injected group). f–h, l–n High-magnification images expanded from selected boxes in c–e and i–k images, respectively, showing pSyn, identified by the brown peroxidase immunoreaction products. α-Syn pathology was absent in the PBS-injected group. In the α-syn-PFFs-injected group, significant decreases in the level of pSyn staining (**P ≤ 0.01) as well as % pSyn+ cells (*P ≤ 0.05) were observed in the group administrated with 0.64 mg/kg/day of AZD3759 in comparison with the Placebo α-syn-PFFs group. pSyn+ cells are pointed with a white arrow. Error bars represent mean ± SD. Scale bars in c–e, i–k and f–h, l–n are 200 μm and 20 μm, respectively. ml medial lemniscus, SNc substantia nigra compacta, SNr substantia nigra reticulate

