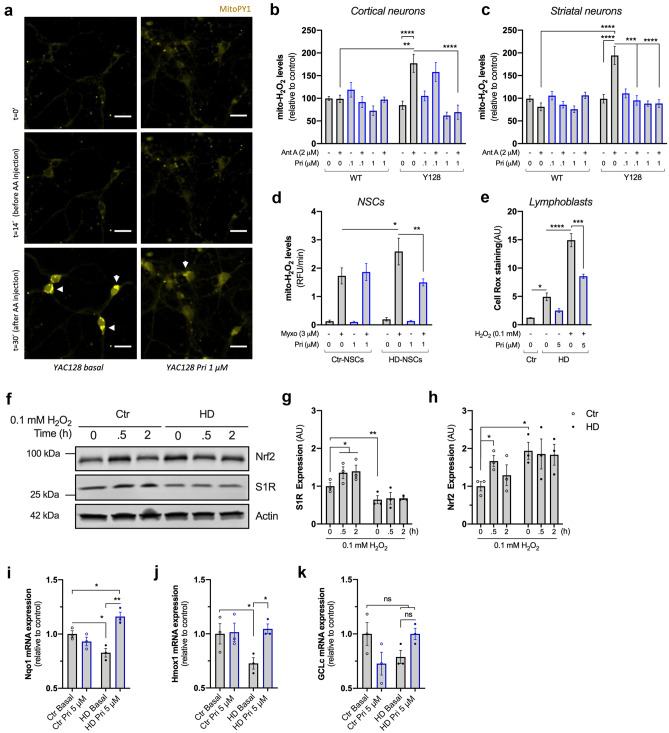
Fig. 5.
Pridopidine reverts oxidative challenge-induced ROS production and impaired expression of Nrf2/ARE genes in HD cells. a Representative image of cortical and striatal YAC128 neurons treated or not with 1 μM pridopidine, and incubated with MitoPY1 fluorescence probe. Mitochondrial H2O2 levels were recorded before and after Antimycin A (Ant A, 2 μM), as indicated (considering ~ 20 cells/condition for St neurons and ~ 10 cells/condition for Ct neurons from four independent cultures). Scale bar = 30 μM. b Quantification of mitochondrial H2O2 levels in cortical neurons. c Quantification of mitochondrial H2O2 levels in striatal neurons. d Quantification of mitochondrial H2O2 in human NSCs treated with 1 μM pridopidine for 24 h in the presence or absence of myxothiazol (Myxo, 3 μM) as indicated in the graph (four independent experiments). e Quantification of ROS levels by CellROX in lymphoblasts treated with 0.1 mM H2O2 for 6 h followed by 5 μM pridopidine treatment for 24 h, where indicated (four independent experiments). f–h Control and HD lymphoblasts were challenged with 0.1 mM H2O2 for 0, 0.5, and 2 h and the total protein levels of S1R and Nrf2 were evaluated by western blotting. Representative images of the blots are depicted in f. Quantification of g S1R and h Nrf2 protein levels. Two-way ANOVA indicated in effect of genotype for both Nrf2 (F(1,12) = 6.987, p = 0.0214) and S1R (F(1,12) = 31.59, p < 0.001) expression. Data obtained from three independent experiments. i–k Control and HD lymphoblasts were treated with pridopidine (5 μM, 24 h), and expression of antioxidant genes Nqo1 (i), Hmox1 (j), and GCLc (k) were evaluated by qPCR (three independent experiments). Statistical significance: *p < 0.05, **p < 0.01, ****p < 0.0001 by 2-way ANOVA followed by Tukey’s multiple comparison test. In e, i–k, *p < 0.05, **p < 0.01, ***p < 0.001, ****p < 0.0001 by Kruskal-Wallis test followed by Dunn multiple comparison test. ns non-significant

