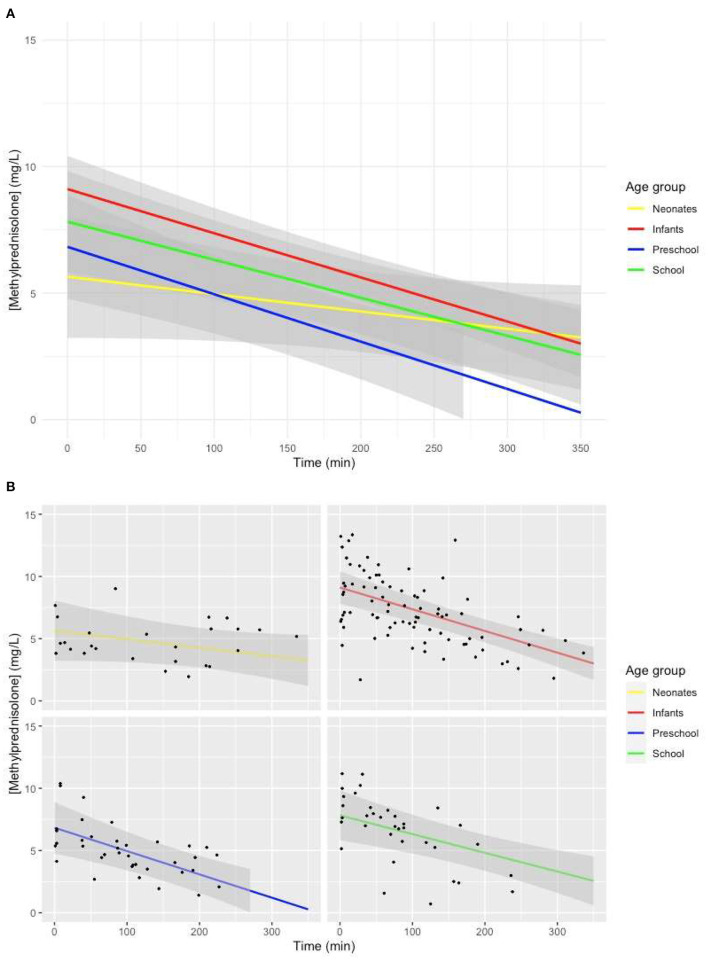
Figure 3.
(A) Predicted MP concentration (mg/L) vs. time (min) for all age groups after initiation of CPB based on the linear mixed-effects model. Gray ribbons: 95% confidence interval. T = 0: start of CPB. (B) Predicted MP concentration (mg/L) vs. time (min) for all age groups after initiation of CPB based on the linear mixed-effects model. Gray ribbon: 95% confidence intervals. T = 0: start of CPB.

