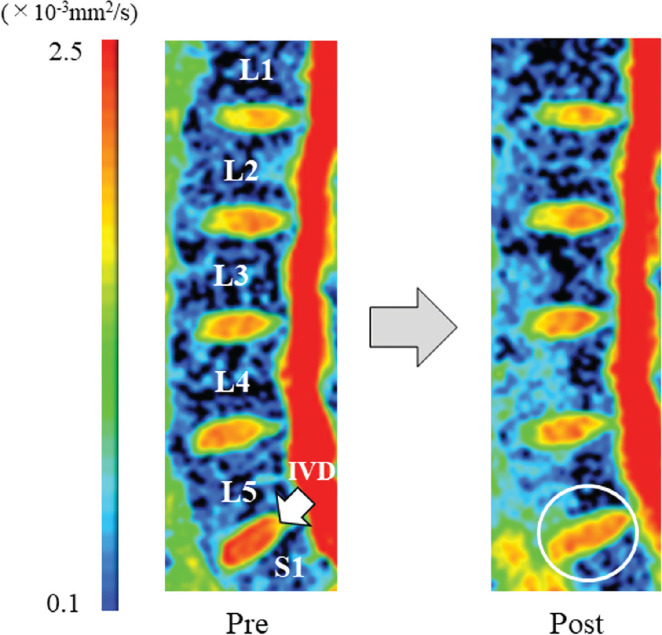
Fig. 3.
Sagittal ADC maps of the lumbar spine of a representative subject (23-year-old male) before and immediately after high-load deadlift exercise. The color-coded pixels on the ADC map correspond to the absolute values of ADC in the tissues. Compared with the pre-exercise ADC map, the post-exercise ADC map shows a decrease in the red region within the L5/S1 IVD (circle). ADC, apparent diffusion coefficient; IVD, intervertebral disc.

