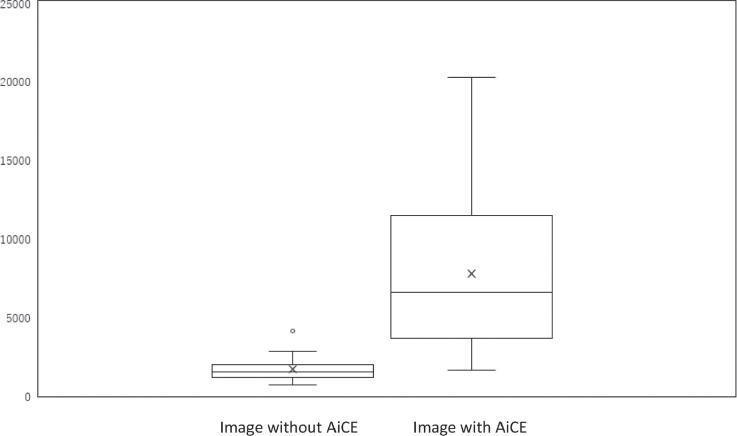
Fig. 3.
A box-and-whisker plot of the contrast-to-noise ratio between the perilymph and the endolymph in HYDROPS-Mi2 images with and without AiCE. The lower side of the rectangle is the first quartile (25th percentile value) and the upper side is the 75th percentile. The horizontal line in the rectangle is the median. The horizontal line under the whisker indicates the 10th percentile value, and the horizontal line above the whisker indicates the 90th percentile. The cross sign in the rectangle is the mean. There is a significant difference between the groups (P = 0.00002). AiCE, advanced intelligent clear-IQ engine, one of the deep learning reconstruction methods; HYDROPS-Mi2, hybrid of reversed image of positive endolymph signal and native image of perilymph signal multiplied with heavily T2-weighted MR cisternography.

