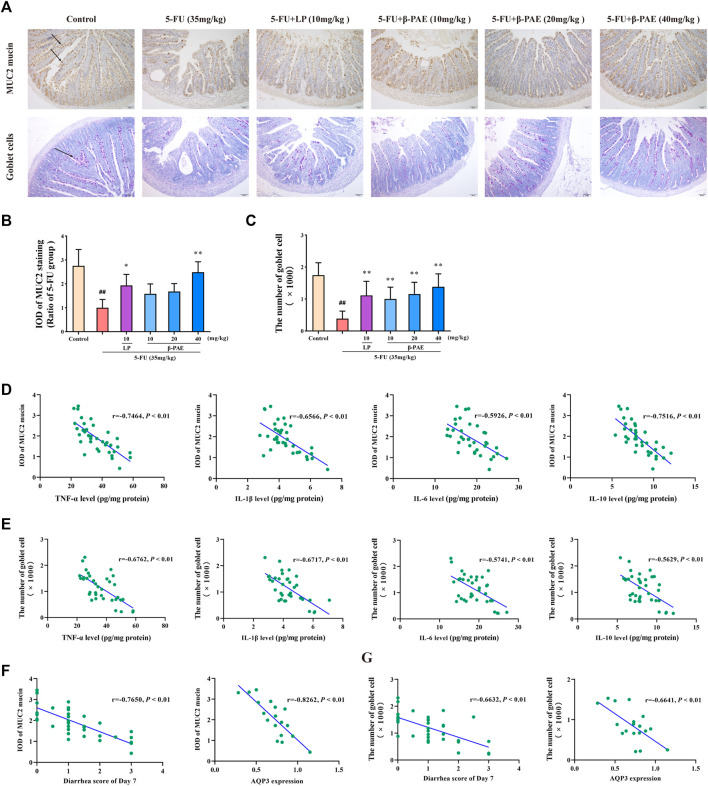
FIGURE 7.
Effects of β-PAE on mucus layer. (A) MUC2 mucin protein and goblet cells in the small intestine (magnification 100x), the arrows indicate positive protein expression; (B) IOD of MUC2 mucin expression; (C) The number of goblet cells; Spearman’s correlation analysis (D) between MUC2 mucin protein expression and inflammatory cytokines level; (E) between goblet cells and inflammatory cytokines level; (F) between MUC2 mucin expression and diarrhea symptoms; and AQP3 levels; (G) between goblet cells and diarrhea symptoms; and AQP3 levels. Data are shown as mean ± SD (n = 6). ## p < 0.01 versus control group; * p < 0.05, ** p < 0.01 versus 5-FU group.

