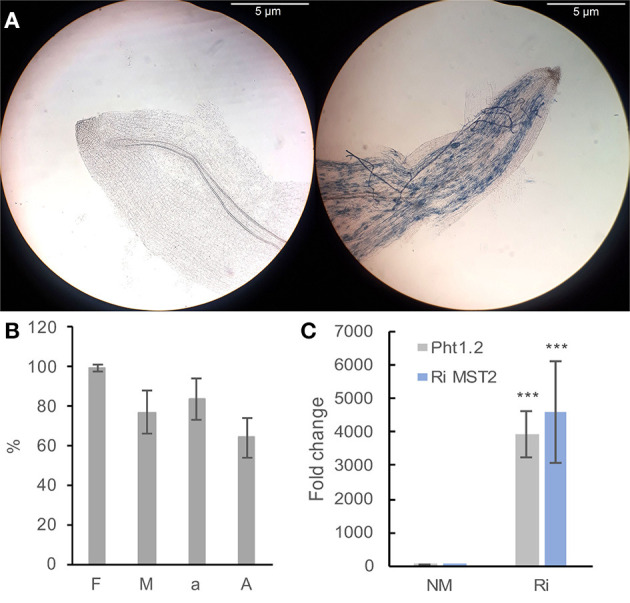
Figure 2.

Plant mycorrhization parameters (A,B) and expression of colonization marker genes in grapevine roots (B). (A) Representative pictures of Ri (right) and NM (left) roots. Pictures were taken with a Nikon ALPHAPHOT-2 microscope (X100 magnification). Bar = 5 μm. (B) F (frequency): percentage of colonized fragments, M (intensity): proportion of hyphae in the root cortex, a: arbuscule content in colonized roots, A: arbuscule abundance in the whole root system (from Trouvelot et al., 1986). Data are the mean ± SD of 12 biological replicates. (C) Expression of the grapevine Pht1.2 phosphate transporter and the R. irregularis RiMST2 hexose transporter in roots of NM and Ri plants. Expression was studied by RT-qPCR in root tips 2 months after mycorrhization. Transcript levels were normalized to V. vinifera ACTIN and EF1α transcript levels. Fold change (2−ΔΔCT method) indicates normalized expression levels in Ri roots compared to the mean of the normalized expression levels measured in NM roots. Data are the mean ± SD of 12 biological replicates. Asterisks indicate significant difference in gene expression between NM and Ri conditions (Kruskall and Wallis, p < 0.001).
