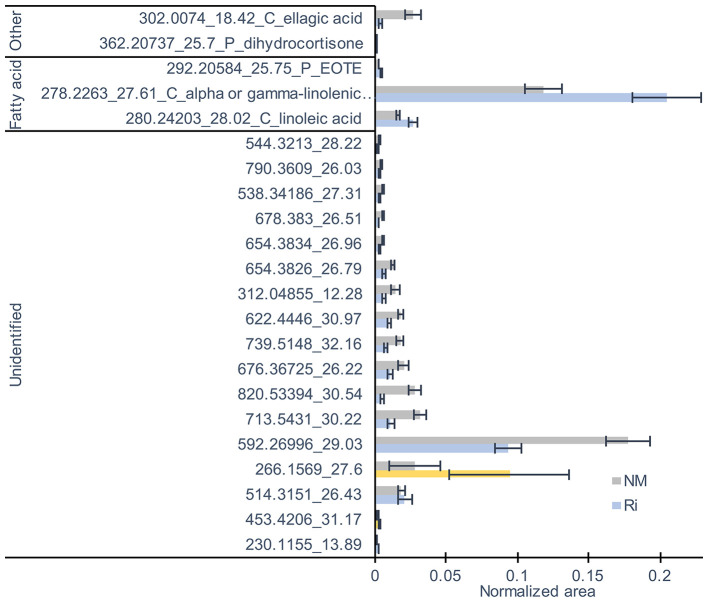
Figure 7.
LC-MS metabolites significantly altered by the mycorrhization in leaves. Contents are expressed as normalized areas for each metabolite. Data are the mean ± SE of 14 independent biological replicates for the NM condition and 11 for the Ri condition. Metabolites significantly different between NM and Ri conditions were identified with a fold change of at least +/– 1.5 and a p value < 0.05 (in blue) or a p value < 0.1 (in yellow, Wilcoxon test).

