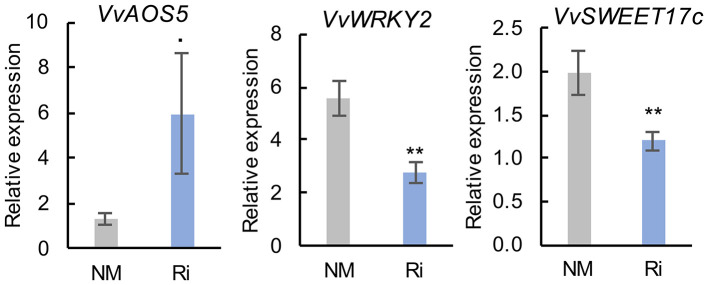
Figure 9.
Expression of genes related to defense responses and sugar transport and metabolism in leaves of NM and Ri plants. Expression was studied by RT-qPCR 2 months after mycorrhization. Transcript levels were normalized to V. vinifera ACTIN and EF1α transcript levels. For each gene, relative expression was obtained with the 2−ΔΔCT method and indicates mean normalized expression in the different conditions compared with normalized expression in the plant, showing the lowest expression level (highest CT value), which was set to 1. Data are the mean ± SE of 12 independent biological replicates for VvAOS5, VvSWEET17c, and VvWRKY2. Asterisks indicate significant difference in gene expression between NM and Ri conditions (Kruskall and Wallis, **p < 0.01, *p < 0.05, ·p < 0.1).

