FIGURE 2.

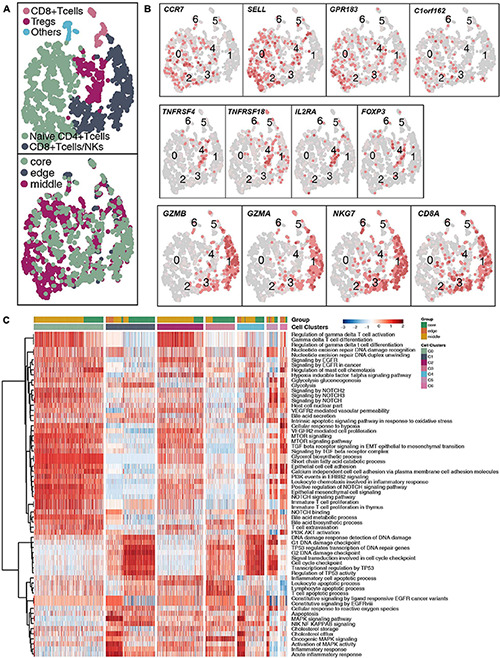
T cell clusters in LUAD. (A) tSNE plot of 1,928 T cells, which are color-coded by their associated cluster or the sample location. (B) tSNE plot, which is color-coded for expression of marker genes for the cell types, as indicated. (C) Differences in pathway activities scored per cell by ssGSEA between the different T cell clusters.
