FIGURE 6.

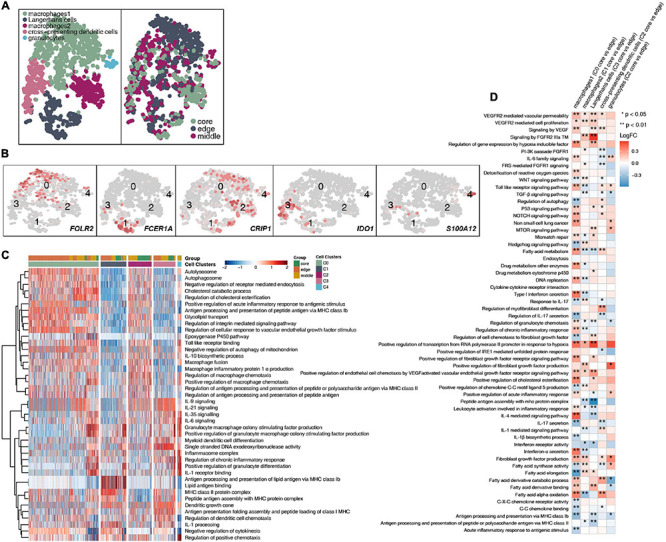
Myeloid cell clusters in LUAD. (A) tSNE plot of 1,524 myeloid cells, which are color-coded by their associated cluster or the sample location. (B) tSNE plot, which is color-coded for expression of marker genes for the cell types, as indicated. (C) Heatmap of the ssGSEA score, as estimated using gene sets from MsiDB, for five myeloid cell clusters from macrophages (cluster 0), Langerhans cells (cluster 1), macrophages (cluster 2), cross-presenting dendritic cells (cluster 3) and granulocytes (cluster 4). (D) Heatmap depicting the mean differences in pathway activities scored per cell by GSVA between the tumor core and tumor edge across the macrophages (cluster 0), Langerhans cells (cluster 1), macrophages (cluster 2), cross-presenting dendritic cells (cluster 3) and granulocytes (cluster 4). The x-axis of the heatmap indicates different myeloid cell clusters, and the y-axis indicates pathway activities scored per cell by GSVA. Each square represents the fold change or difference in each indicated pathway activity scored per cell by GSVA between the tumor core and tumor edge across macrophages (cluster 0), Langerhans cells (cluster 1), macrophages (cluster 2), cross-presenting dendritic cells (cluster 3) and granulocytes (cluster 4). Red indicates upregulation, while blue indicates downregulation. *P < 0.05; **P < 0.01.
