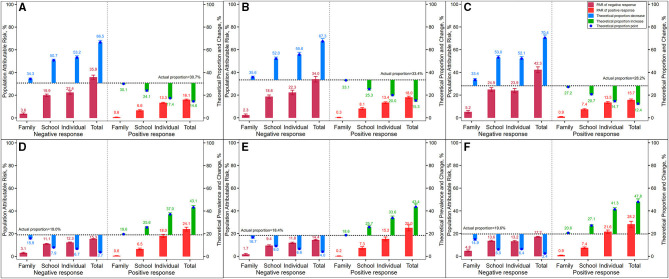
Figure 5.
The population attributable risk and theoretical proportions of low- and high-PFI levels (dependent variables) and its theoretical changes to actual levels if 20 related influencing factors (independent variables) were controlled. (A) Total low PFI level. (B) Boys low PFI level. (C) Girls low PFI level. (D) Total high PFI level. (E) Boys high PFI level. (F) Girls high PFI level.

