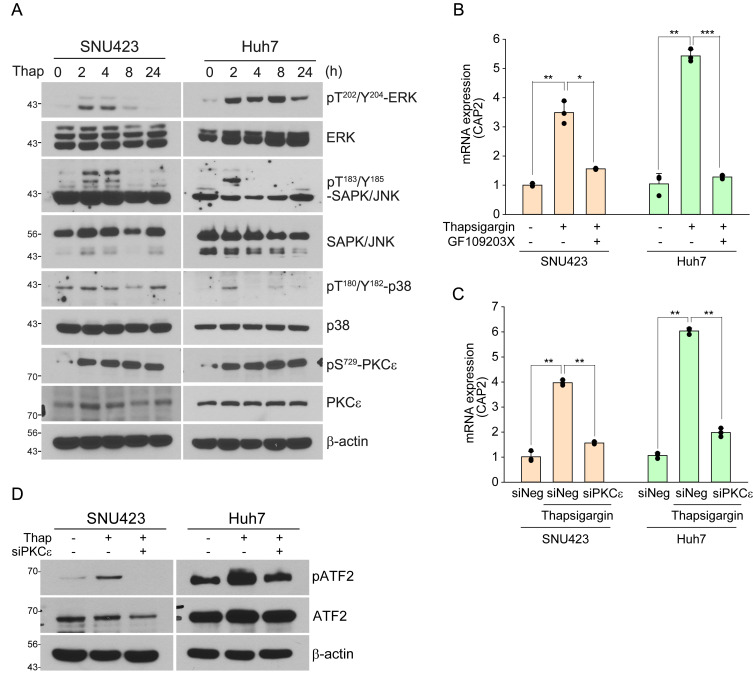
Fig. 3. PKCε is involved in the ER stress-induced ATF2 activation.
(A) SNU423 and Huh7 cells are treated with thapsigargin (Thap; 50 nM and 100 nM, respectively) for the indicated times and cell lysates are examined by western blotting with the indicated antibodies. (B) SNU423 and Huh7 cells are treated with thapsigargin (50 nM and 100 nM, respectively) alone or with thapsigargin plus the PKCε inhibitor GF109203X (GF, 20 μM) for 24 h. Relative expression of CAP2 mRNA is measured by qRT-PCR. Data represent mean ± SEM of 3 independent experiments. (C and D) SNU423 and Huh7 cells are transiently transfected with siNegative control (siNeg) or siPKC ε and after 24 h, thapsigargin (100 nM) is treated for 24 h. CAP2 expression is measured by qRT-PCR. Data represent mean ± SEM of three independent experiments (C). ATF2 activation is monitored by western blotting with the indicated antibodies (D). *P < 0.05, **P < 0.01, and ***P < 0.001.

