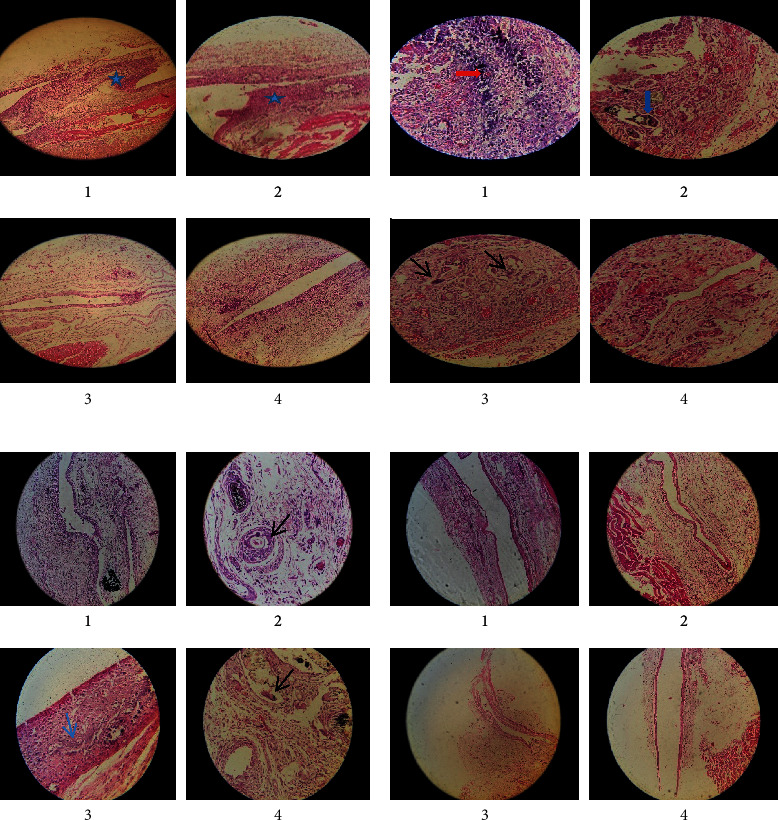
Figure 1.

(a) Sample tissue of microtube implantation site on the 7th day with hematoxylin-eosin staining; 1- MTA Bio, 2- MTA Root, 3- MTA Angelus, and 4- MTA control; magnification ×10. (b) Sample tissue of the microtube implantation site in the 7th day with hematoxylin-eosin staining. Black spike: giant cell, blue spike: foregin body, and red spike: calcification; 1-MTA Bio, 2- MTA Root, 3- MTA Angelus, and 4- MTA control; magnification: ×40. (c) Sample tissue of the microtube implantation site on the 15th day with hematoxylin-eosin staining; magnification ×10, ×40; black spike: giant cell and blue spike: calcification. (d) Sample tissue of the microtube implantation site on the 60th day with hematoxylin-eosin staining; magnification ×10.
