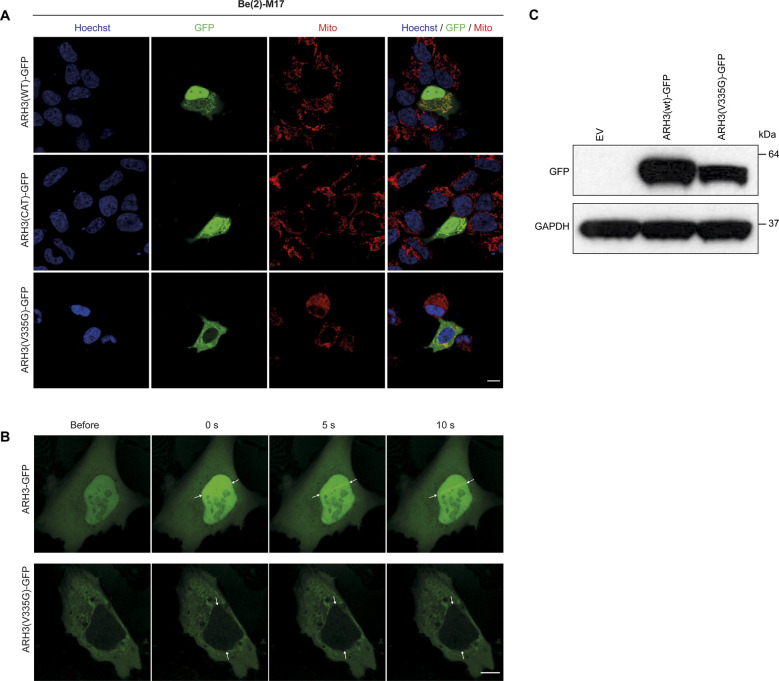
Figure S2. Live cell imaging of U2OS overexpression model.
(A) Localization of ARH3 protein as checked by live cell imaging for GFP-tagged ARH3 (green) with mitotracker (red) and DAPI (blue) staining in separate and merged images in ARH3(WT)-GFP, ARH3(CAT)-GFP, and ARH3(V335G)-GFP in transfected BE(2)-M17 neuroblastoma cells. Size bar indicates 10 µm. (B) Recruitment of ARH3-GFP to the nucleus and DNA damage sites (white arrows) upon laser-induced DNA damage. The ARH3(V335G)-GFP protein does not relocate upon laser-induced DNA damage. (C) Expression of ARH3(WT)-GFP and ARH3(V335)-GFP protein in transfected U2OS cells. Size bar indicates 10 µm.

