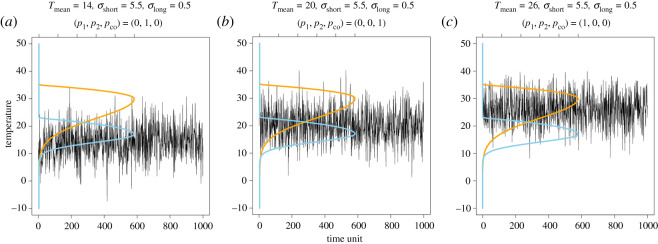
Figure 4.
Mean temperature (Tmean) affects species coexistence even when long- and short-term variations remain unchanged. (a) When the mean is lower than the optimal temperature of species 2 (blue curve), species 2 excludes species 1. (b) However, when the mean is between the optima of the two species, species coexistence can occur. (c) Finally, when the mean is above the optimum of species 1, it excludes species 2. Temperature variability is the same in all three cases, where σlong = 0.5, σshort = 5.5. Additionally, p1, p2 and pco represent the probability of species 1 dominating, species 2 dominating and species coexistence, respectively. Note that the mean temperature is different from windowed averages (e.g. figure 3s), as the mean is the actual average of the temperature distribution used for generating time series. (Online version in colour.)

