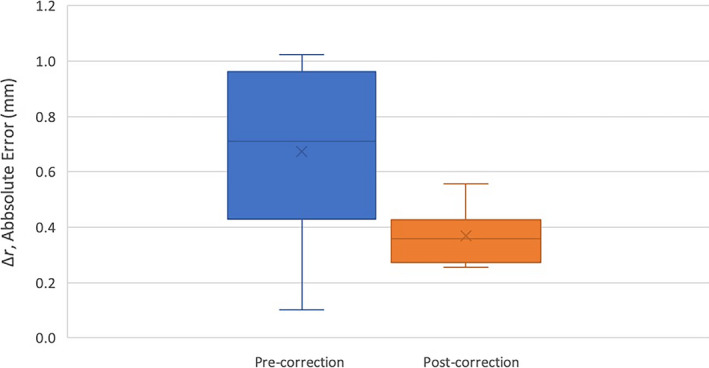
Figure 3.

Absolute error, , of measured grid coordinates along a diagonal of the grid phantom for the pre‐ (left, blue) and post‐correction (right, orange) data sets (as illustrated in Fig. 2). The cross represents the mean. The lines in descending order represent the maximum, 3rd quartile, median, 1st quartile and minimum values of data.
