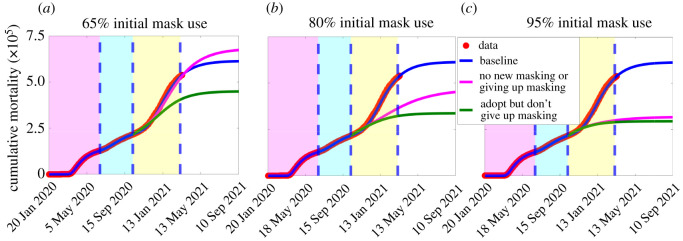
Figure 10.
Simulations of the extended model (S.1)–(S.3), given in electronic supplementary material. Assessment of the impact of increases in the total initial size of mask wearers on cumulative mortality. (a) The initial population of mask wearers is 65%. (b) The initial population of mask wearers is 80%. (c) The initial population of mask wearers is 95%. The magenta curve (no behaviour change) depicts the scenario in which there is no new masking and already masking individuals do not give up masking, while the green curve depicts the scenario in which new people opt for masking and existing masking individuals do not abandon masking. The magenta, cyan and yellow regions denote the first pandemic wave, the second pandemic wave, and the portion of the third pandemic wave up to 11 March 2021, respectively, while the dashed vertical blue lines demarcate the first and second wave and the portion of the third wave up to 11 March 2021. The values of the other parameters of the extended model are as given in table 1 and electronic supplementary material, tables S5 and S6.

