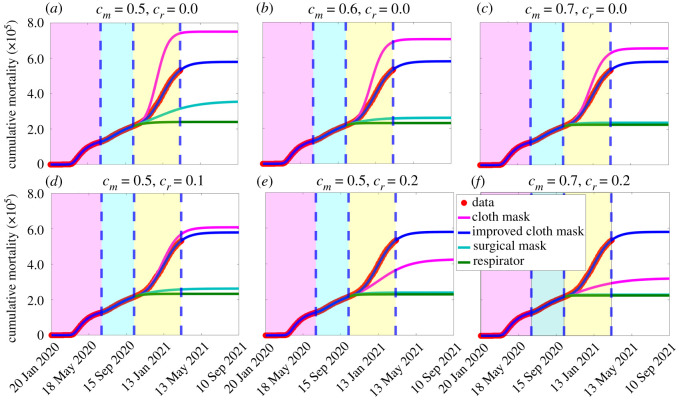
Figure 5.
Simulations of the basic model (2.1) to assess the impact of masks type (i.e. cloth mask only, improved cloth masks only, surgical masks only, and respirators only), as a function of time, for various levels of face masks compliance (cm) and increasing levels of other NPIs from their baseline (cr), starting 12 October 2021. (a) various mask types with compliance set at 50% (i.e. cm = 0.5) and other NPIs maintained at baseline (i.e. cr = 0). (b) various mask types with compliance set at 60% (i.e. cm = 0.6) and other NPIs maintained at baseline (i.e. cr = 0). (c) various mask types with compliance set at 70% (i.e. cm = 0.6) and other NPIs maintained at baseline (i.e. cr = 0). (d) various mask types with compliance set at 50% (i.e. cm = 0.5) and other NPIs increased to 10% from their baseline (i.e. cr = 0.1). (e) various mask types with compliance set at 50% (i.e. cm = 0.5) and other NPIs increased to 20% from their baseline (i.e. cr = 0.2). (f) various face mask types with compliance set at 70% (i.e. cr = 0.7) and other NPIs increased to 20% from their baseline (i.e. cr = 0.2). Red dots represent observed cumulative mortality data. The other parameter values used in the simulations are as given in table 1 and the third wave parameter values in table 2. The shaded magenta and green regions represent the beginning and end of the first and second pandemic waves in the USA, respectively. The shaded yellow region represents the beginning of the third pandemic wave until 11 March 2021. Dashed vertical blue lines demarcate the three waves.

