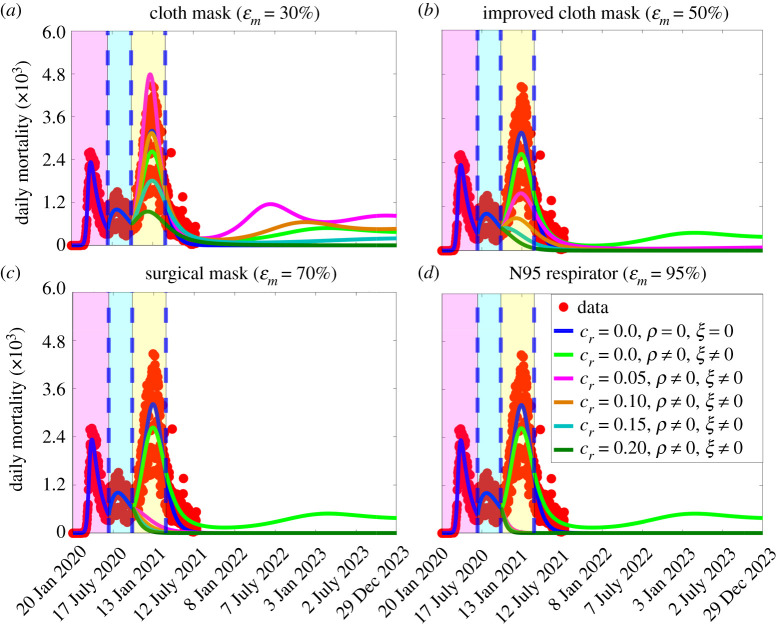
Figure 7.
Simulations of the basic model (2.1) to assess the combined impact of masks, vaccination, waning natural and vaccine-derived immunity and reduction in community transmission due to other NPIs on the daily COVID-19 mortality as a function of time, and various mask types, for the USA. Reduction in community transmission due to other NPIs and vaccination are implemented at the beginning of the third wave (i.e. from 12 October 2020). For these simulations, only the Pfizer vaccine is used (with estimated efficacy of 95%) and the vaccination rate is set at ξ = 7.4 × 10⁴ day−1 (i.e. 250 000 individuals are fully vaccinated daily). The vaccine-derived and natural immunity wane after six months (which corresponds to ρ = 5.6 × 10³ day−1). (a) Only cloth masks are used. (b) Only improved cloth masks are used. (c) Only surgical masks are used. (d) Only respirators (or equivalent) are used. For the blue and light green curves (baseline scenarios) in figures (a–d), the mask efficacy is maintained at 50% (i.e. ɛm = 0.5). The other parameter values used in the simulations are given in tables 1 and 2. The shaded magenta and green regions represent the beginning and end of the first and second pandemic waves in the USA, respectively. The shaded yellow region represents the beginning of the third pandemic wave until 11 March 2021. Dashed vertical blue lines demarcate the three waves.

