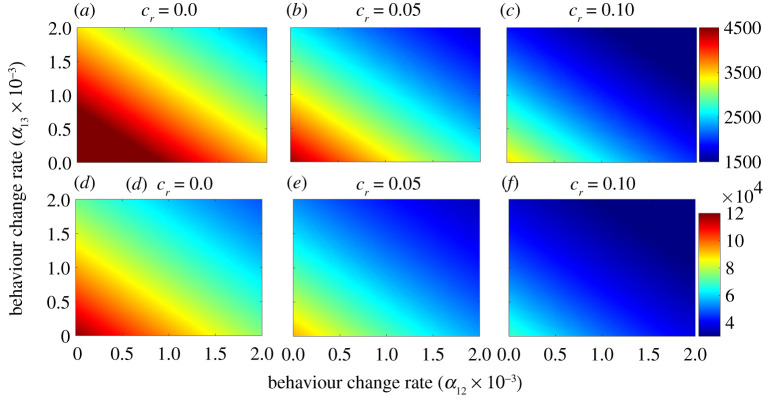
Figure 8.
Heatmaps of the extended model (S.1)–(S.3), given in electronic supplementary material, showing the peak daily mortality (a–c) and peak daily hospitalizations (d–f), as a function of the daily rate at which non-wearers opt to wear surgical masks (α12) or respirators (α13) for increasing baseline coverage levels of other NPIs (cr), starting 12 October 2020. (a) cr = 0.0, (b) cr = 0.05, (c) cr = 0.1, (d) cr = 0.0, (e) cr = 0.05 and (f) cr = 0.1. The values of the other parameters of the extended model used in these simulations are as given in table 1 and electronic supplementary material, table S6.

