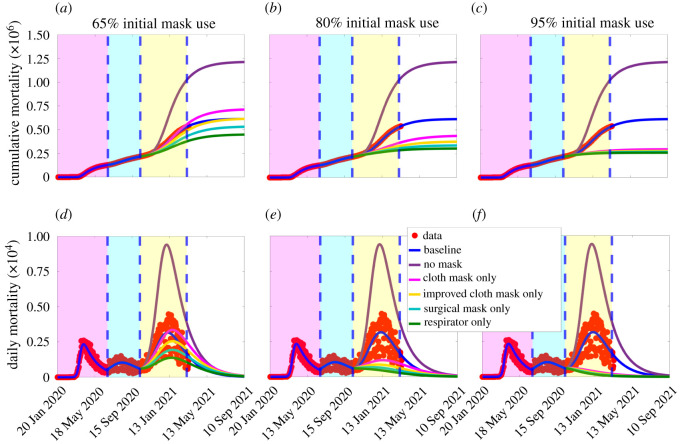
Figure 9.
Simulations of the extended model (S.1)–(S.3), given in electronic supplementary material, showing the effects of mask types and initial size of total population of mask wearers (N2(0) + N3(0)) on the cumulative (a–c) and daily (d–f) COVID-19 mortality. (a,d): total initial size of mask wearers is 65%; (b,e) total initial size of mask wearers is 80%; (c,f): total initial size of mask wearers is 95%. The values of the other parameters of the extended model used in the simulations are as given in table 1 and electronic supplementary material, tables S5 and S6. The shaded magenta and green regions represent the beginning and end of the first and second pandemic waves in the USA, respectively. The shaded yellow region represents the beginning of the third pandemic wave until 11 March 2021. Dashed vertical blue lines demarcate the three waves.

