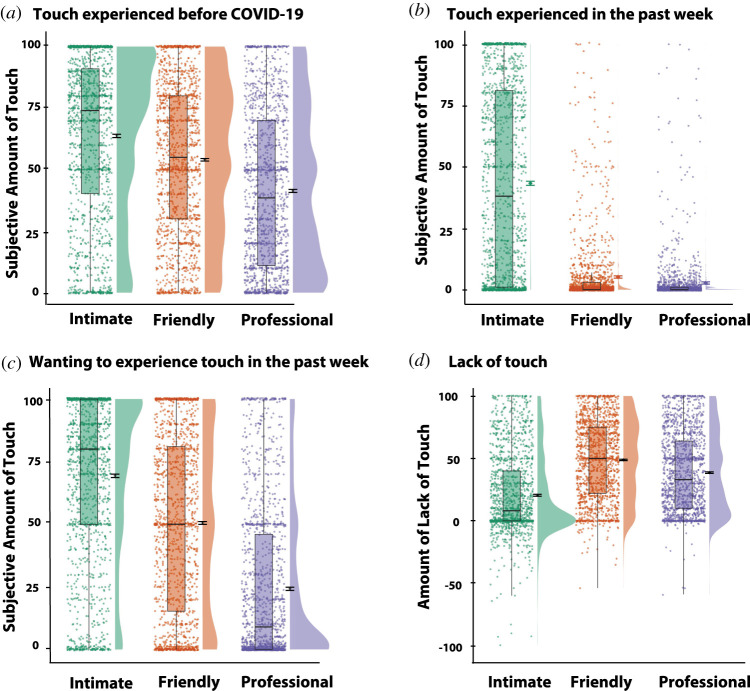
Figure 2.
Ratings for touch experienced during COVID-19 for the three types of social touch: intimate, professional and friendly. (a) ‘Before COVID-19, How much touch of these different types of ‘social’ touch were you getting?’ from 0, not at all, to 100, a lot; (b) ‘In the past week, How much touch of these different types of ‘social’ touch have you been getting?’ from 0, not at all, to 100, a lot; (c) ‘In the past week, How much would you have wanted to experience these different types of ‘social’ touch?’ from 0, not at all, to 100, a lot. (d) Computed score for lack of touch during COVID-19: touch experienced in the last week was subtracted from touch experienced before COVID-19. Group distributions as unmirrored violin plots (probability density functions), individual data points, boxplot, mean and error bars denoting ±1 s.e.m.

