

Abstract
The success of biomaterials for bone regeneration relies on many factors, among which osseointegration plays a key role. Biogran (BG) is a bioactive glass commonly employed as a bone graft in dental procedures. Despite its use in clinical practice, the capability of BG to promote osseointegration has never been resolved at the nanoscale. In this paper, we present the workflow for characterizing the interface between newly formed bone and BG in a preclinical rat model. Areas of bone–BG contact were first identified by backscattered electron imaging in a scanning electron microscope. A focused ion beam in situ lift-out protocol was employed to prepare ultrathin samples for transmission electron microscopy analysis. The bone–BG gradual interface, i.e. the biointerphase, was visualized at the nanoscale with unprecedented resolution thanks to scanning transmission electron microscopy. Finally, we present a method to view the bone–BG interface in three dimensions using electron tomography.
Keywords: Biogran, osseointegration, biointerphase, scanning transmission electron microscopy, electron tomography, focused ion beam
1. Introduction
Osseointegration, i.e. the direct contact between bone and implant surface, is a key requisite for the success of cementless bone implants [1]. In vivo studies using animal models are routinely performed to explore new implant biomaterials and novel approaches to improve osseointegration [2,3]. Retrieved implants are commonly examined at the microscale, usually by histology to assess tissue status and relevant cells, and often by microcomputed tomography (micro-CT) to quantify the bone–implant contact in three dimensions (3D) [4]. However, bone is a hierarchical tissue with features down to the nanoscale, hence it is fitting to use different tools to assess osseointegration across multiple length scales [5]. In particular, both native and new bone tissue forming at the interface with an implanted biomaterial have in the mineralized collagen fibril their nanoscopic building block [6,7]. Therefore, visualization of bone–implant interfaces at the nanoscale can reveal the exact arrangement of the organic (type I collagen [8]) and inorganic (hydroxyapatite [8]) nano-constituents of newly formed bone, in turn shedding light on the process of new bone formation around a biomaterial.
Since the 1980s, transmission electron microscopy (TEM) has been regularly used to visualize the bone–implant interface at the nanoscale [1,9,10]. The use of a convergent beam in scanning transmission electron microscopy (STEM) mode is often preferred to that of parallel illumination in conventional TEM when imaging bone interfaces. The interaction of the STEM electron probe with the sample results in scattering of the incident electron beam, which can then be collected when it emerges from the sample using a high-angle annular dark-field (HAADF) detector [11]. HAADF-STEM imaging is particularly useful for resolving bone ultrastructure and interfaces since the contrast in the images depends on the atomic number Z, called Z-contrast or compositional contrast imaging [11]. Hence, heavier elements (e.g. bone mineral phase, metallic/ceramic biomaterials) can be easily distinguished from lighter ones (e.g. bone organic phase) as they appear brighter.
For several years, sample preparation of retrieved implants for (S)TEM characterization posed significant challenges, as samples, usually referred to as lamellae, need to be some 100–200 nm thick to be electron transparent, i.e. to ensure enough signal is collected to obtain a (S)TEM image. Significant enhancement in sample preparation was achieved with the use of dual-beam focused ion beam (FIB)–scanning electron microscopy (SEM) instruments. Applied for the first time to a bone–dental implant interface in 2005 [12], FIB rapidly became a prime tool to prepare electron transparent lamellae of bone interfaces for (S)TEM imaging with minimal sample disruption and with site-specificity in dual beam instruments [13–16].
(S)TEM images are two-dimensional (2D) projections of ultrathin but 3D samples, which results in the impossibility to locate specific features along the thickness of the sample. This can be an issue especially as bone nano-constituents, namely the mineralized collagen fibrils, are smaller than the lamella thickness and overlap each other in the 2D (S)TEM projection-based image. Thus, they cannot be truly represented and resolved [5]. High-resolution 3D imaging techniques, such as electron tomography (ET), can be used to overcome this limitation [17,18]. ET is based on the acquisition of (S)TEM images at different tilt angles, usually over a ±70° range, and then their back-projection or implementation of iterative algorithms to reconstruct a 3D volume representative of the sample [17]. ET carried out in HAADF-STEM mode has proved to be a powerful tool to investigate bone interfaces [19].
Hereinafter, we report on the nanoscale characterization of the interface between newly formed bone and Biogran (BG). BG is a commercially available bioactive glass commonly used in dental clinical practice as a synthetic bone graft [20]. While bioactivity of BG has been previously investigated at the microscale using scanning electron microscopy-energy dispersive X-ray spectroscopy (SEM-EDX) [21], to our knowledge, the bone-forming ability of BG, thus the bone–BG interface, has never been resolved at the nanoscale. Combining backscattered electron (BSE) imaging in SEM, FIB in situ lift-out, HAADF-STEM imaging and ET, we present a method to resolve the bone–BG interface at the nanoscale and evaluate the ultrastructure of newly formed bone on its surface.
2. Material and methods
2.1. Premise: peri-implant defect surgery and implant installation
Samples used to investigate the bone–BG interface were part of an in vivo study using male Wistar rats (unpublished work) conducted with institutional ethical approval (Process FOA no. 2017-00199). A total of 80 rats were used, but only one animal was considered for the characterization of the bone–BG interface presented herein. Trichotomy was performed in the medial portion of the right and left tibia of the animals previously sedated. Following the procedure developed by Gomes-Ferreira [22], a 15 mm-long incision was made in the left and right tibial metaphysis. After removal of soft tissue to expose the bone, milling was carried out with a 1.3 mm diameter spiral drill on both cortices, and a 2 mm, a pilot 2/3 (2.0 mm initial cut, followed by 3.0 mm cut) and a 3.0 mm milling cutter in the upper cortical and medullary portions of the tibia. The defect was filled with Biogran (Biomet 3i, Palm Beach Gardens, USA) in the form of irregular granules approximately 300–355 µm in size. Immediately after, a commercially pure grade IV titanium implant with surface treated by double acid attack was inserted in the cavity so that it contacted bone only in the lower and upper cortices. The tissues were then sutured in planes using absorbable thread (Polygalactin 910—Vycril 4.0, Ethicon, Johnson, São José dos Campos, Brazil) with continuous stitches in the deep plane and with monofilament thread (Nylon 5.0, Ethicon, Johnson, São José dos Campos, Brazil) with interrupted sutures in the outermost plane. Each animal received two implants, i.e. one in each tibial metaphysis.
The steps leading to the nanoscale characterization of the bone–BG interface are graphically summarized in figure 1. Each step illustrated in figure 1 is described in more detail in the following sections. The same sample was used for all characterization methods to ensure a correlative analytical workflow.
Figure 1.

Workflow for the nanoscale characterization of the bone–BG interface. (1) Sample retrieval and preparation by resin embedding, polishing and mounting and coating for subsequent SEM. (2) Microscale characterization and identification of the interface by BSE imaging in SEM. (3) Electron transparent lamella preparation by FIB in situ lift-out. (4) Nanoscale characterization of the interface by STEM imaging and ET tilt-series acquisition. (5) 3D representation of the interface achieved using reconstruction algorithms. Created with BioRender.com.
2.2. Sample retrieval and preparation
Thirty days after surgery and implant installation, the animals were euthanized by an overdose of inhaled anaesthetic (Halothane, Tanohalo, Cistália Produtos Químicos Farmacêuticos LTDA, Nova Itapira, Itapira, Brazil). This retrieval time point was selected in order to evaluate the peak of new bone formation prior to remodelling and the early stages of BG dissolution. The titanium implant and the surrounding tissue, including BG particles still present in the area, were retrieved. The samples were fixed in 10% formaldehyde (Analytical Reagents, Dinâmica Odonto-Hospitalar Ltda, Catanduva, Brazil) for 48 h, rinsed under running water for 24 h and dehydrated with a graded series of ethanol (70–80–90–100%). Samples were then embedded in resin (Technovit, Kulzer GmbH, Wehrheim, Germany) and divided in half along the long axis of the Ti implant using a cutting system (Exakt Apparatebau GmbH, Hamburg, Germany), and finally polished.
2.3. Microscale characterization: identification of interface
The embedded sample was mounted on a SEM aluminium stub by conductive carbon tape. The sample was wrapped tightly with aluminium tape leaving just the titanium implant and the area around exposed. Nickel paint was used to connect the titanium implant to the base of the aluminium stub. Finally, the sample was coated with a thin layer of carbon by thermal evaporation. Conductive tapes, paint and coating were used to minimize the risk of charging in the subsequent SEM imaging, as bone, BG and embedding resin are all non-conductive materials. The sample was imaged in BSE mode in a SEM instrument (FEI Magellan 400 XHR, ThermoFisher Scientific, Hillsboro, USA) operated at 5 kV.
2.4. Electron transparent lamella preparation
An in situ lift-out protocol was used to prepare an electron transparent lamella in a dual-beam FIB instrument (Zeiss NVision 40, Carl Zeiss AG, Oberkochen, Germany) with a 30 kV Ga ion column, a gas injection system and a micromanipulator (Kleindiek Nanotechnik GmbH, Reutlingen, Germany). The main steps of the lamella preparation are shown in figure 2. First, an approximately 12 × 1.2 µm2-wide region of interest (ROI) of new bone in close contact with BG was identified (figure 2a). The ROI was coated with a thin layer of, firstly, carbon, and, secondly, tungsten by electron beam deposition (figure 2b,c). Following this, a 3 µm-thick layer of tungsten was deposited over the same area by ion beam deposition (figure 2d). Afterwards, trapezoidal and rectangular trenches on three sides of the ROI were milled away with the Ga ion beam at 30 kV using progressively lower current (45, 27, 13 and 6.5 nA) as approaching the ROI (figure 2e). The micromanipulator was attached to the sample by a patch of W deposited by ion beam deposition (figure 2f). After cutting free the last side of the ROI, the lamella was lifted out and attached to the top post of a Cu grid by ion beam deposition of W (figure 2g). Subsequent thinning of the lamella to obtain an electron transparent sample (200–300 nm thick) was carried out at 30 kV in multiple steps using progressively lower currents equal to 150, 80 and 40 pA (figure 2h–j). Only an area 6 µm wide was thinned, leaving the lamella thicker on the sides for better support and to minimize warping. In order to reduce the extent of these support sides in the field of view, a region in the angular range of 70° from the orthogonal to the sample top view was cleared out to enable tilting to at least ±70° during tomography (figure 2i). This would allow one to maximize the width of the sample visible in STEM at high tilt angles, as the thicker sides would otherwise fall in the field of view, thus partially obstructing the image. Lastly, to limit Ga ion implantation and amorphization damage, as well as to further thin the lamella, final beam polishing was carried out in two subsequent steps at 10 kV with a current of 80 pA, and 5 kV with a current of 60 pA.
Figure 2.

Sequence representing the main steps of the FIB in situ lift-out at the bone–BG interface. (a) Identification of the region of interest (ROI). (b) Carbon coating of ROI by electron beam deposition. (c) Tungsten coating of ROI by electron beam deposition. (d) Additional tungsten coating of ROI by ion beam deposition to a thickness of 2–3 µm. (e) Milling of trenches around ROI. (f) Attachment of micromanipulator. (g) Lift-out and attachment to TEM grid post. (h) Thinning (electron beam image). (i) Thinning of the sample and extra milling of the support sides falling within the ±70° STEM tilt range (shown before milling on the right and after milling on the left), marked in figure (ion beam image). (j) Final thinning to approximately 200 nm thick. The electron transparent lamella is in the region marked by the yellow dotted line. Scale bars are 5 µm.
2.5. Nanoscale characterization of the interface
Images of the electron transparent lamella were acquired with a HAADF detector in a STEM instrument (FEI Titan 80–300 LB, ThermoFisher Scientific, Hillsboro, USA) operated at 200 kV. The same STEM instrument was used to acquire the tilt-series for ET by mounting the lamella in a Fischione Model 2020 advanced tomography holder (Fischione Instruments, Export, USA). HAADF-STEM images for tomography were acquired at 300 kV. A linear single-axis tilt scheme was used, collecting images every 2° over an angular range going from −60° to +74° (electronic supplementary material, data S1).
2.6. Three-dimensional reconstruction of the interface
Reconstruction of the tilt-series was completed using Inspect 3D 4.1.2 (ThermoFisher Scientific, Hillsboro, USA). First, the 68 images recorded were aligned by cross-correlation of low-pass and high-pass filtered images. The aligned series was then reconstructed using a simultaneous iterative reconstruction technique (SIRT) with 25 iterations and applying a tilt axis correction in the x-direction (along the axis of the holder in the plane of the sample).
The reconstructed series was visualized in Avizo 9.2.0 (ThermoFisher Scientific, Hillsboro, USA). The (x, y, z) dimensions of the 3D reconstructed volume were obtained in Avizo when inputting the voxel size. The voxel size in the x- and y-directions (dx and dy, respectively) was assumed to be equal to the pixel size in the individual STEM images of the tilt-series, taking into account a two-fold binning applied in the reconstruction phase. The voxel size in z (dz) was obtained by multiplying dx by an elongation factor (exz) defined as follows from [23]:
where α is the maximum tilt angle expressed in rad units. As our tilt range was not symmetrical (−60° to +74°), we considered α as the mean value of the two extremes of the range. Therefore, the voxel size resulted to be equal to (1.46 nm, 1.46 nm, 2.01 nm) in (x, y, z). The ‘orthogonal slices’ (orthoslices) and volume rendering (Volren) modules available in Avizo were used for the visualization and analysis of the reconstructed electron tomogram in 2D and 3D, respectively.
3. Results and discussion
3.1. Sample retrieval and preparation
All the animals used in the study survived the implant installation surgery and were euthanized. A section of bone tissue around the implant site, including the Ti implant and BG particles still present in the area, was successfully retrieved and prepared for subsequent characterization. An example of a retrieved sample after embedding and preparation for SEM analysis is available in the electronic supplementary material (figure S1).
3.2. Microscale characterization: identification of interface
New bone growth around Ti implant and BG particles was first evaluated at the microscale acquiring BSE signal in SEM. A survey of the area around the implant site was carried out at low magnification (figure 3a). This enabled the identification of areas where the bone was growing in contact with BG particles (figure 3b,c). Said bone was identified as newly formed since it was not present in the region at the time of implant surgery and BG insertion. Subsequent ultrastructural analyses completed in STEM further confirmed the immature state of the tissue in contact with BG particles, as described later. BSE is a suitable imaging mode to characterize bone, as contrast arises from differences in composition [24], which easily distinguishes bone from the surrounding embed resin. On the contrary, topography-based contrast in secondary electron mode is unsuitable to discriminate between the materials of interest since both are polished flat. Bone and BG displayed a similar greyscale level in BSE images due to their similar composition rich in Ca and P. Bone regions could be identified due to the presence of some cells and their slightly darker appearance compared to BG particles. In addition, BG particles were characterized by cracks running through them, and by more evident polishing marks. The presence of excavated and cracked BG particles has been reported by previous microscale characterization of bioactive glass granules retrieved after implantation in vivo [21,25]. Cracking and excavation of the particles are compatible to the mechanism of BG dissolution and bone formation in vivo [21,26]. It is also possible the higher frequency of cracking occurred during sample retrieval, embedding and polishing, on the more brittle BG material [21]. In some instances, we observed contrast gradients within BG particles, which displayed a darker central region surrounded by a brighter layer. This is in agreement with previous SEM-EDX analysis revealing that ion exchange in vivo causes a redistribution of the BG elements, creating an outer shell depleted of Si and richer in Ca and P [21]. Based on how contrast is generated in BSE images [24], the central Si-rich region will appear darker than the outer layer with Ca and P, as Si has a lower atomic number.
Figure 3.
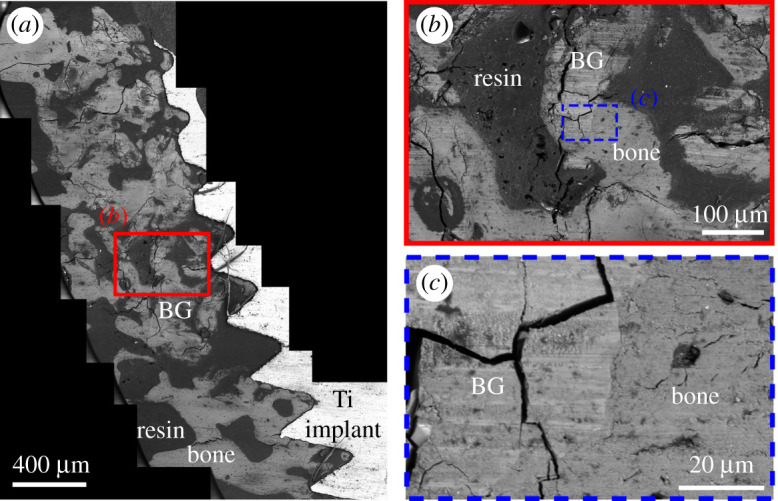
(a) BSE mosaic image of a retrieved sample, where remains of BG particles and regions of new bone formation can be identified (labelled in the image). (b) Zoomed in view of the region outlined in (a) showing new bone in contact with a BG particle. This area is further magnified in (c). BG particles can be distinguished from bone as they appear slightly brighter and they show more polishing marks and the presence of cracks running through them. Several BG particles appear cracked and excavated, as a consequence of BG dissolution and new bone formation occurring in vivo.
Micro-CT is often included in the multiscale characterization of osseointegration, providing information at the microscale with a larger field of view than SEM, at the cost of lower resolution [4,5,27]. More recently, work has attempted to make a correlative use of micro-CT and electron microscopy-based analyses [28,29]. This was not applicable to the bone–BG interface here, given the similar contrast observed in BSE-SEM, which was used for identifying areas of bone in contact with BG for subsequent higher-resolution imaging. On the other hand, micro-CT is more easily implemented in the characterization of the bone–implant interface to materials such as titanium, that significantly differ from bone in terms of X-ray absorption [4,27].
3.3. Electron transparent lamella preparation
FIB in situ lift-out is a well-established method to preserve intact bone interfaces and bone structure, inducing less damage and artefacts compared to other techniques, such as ultramicrotomy [13,14]. For the first time, this technique was used to prepare a bone–BG interface. Even for this type of interface, the in situ lift-out protocol was confirmed as an ideal method for preparing an electron transparent lamella while preserving the interface and the sample structural features, as observed previously for other bone–biomaterial combinations [15,16,30]. BG and bone displayed different milling behaviour, with BG milling at a slower rate compared to bone, likely due to its lower porosity and increased toughness and hardness compared to bone. In addition, although bone and BG have similar composition, rich in Ca and P, the absence of organic components in BG could also contribute to its slower milling rate compared to bone. To compensate for the different milling rate, sometimes areas made of BG were milled twice with respect to the adjacent bone to obtain a more even lamella thickness. Figure 4a represents a low magnification, overview image of the whole lamella acquired with a HAADF detector in a STEM instrument operated at 200 kV. This confirmed that the in situ lift-out protocol obtained an intact electron transparent lamella, with negligible curtaining artefacts, but some degree of bending, potentially caused by shrinkage of the embedding resin or damage to the organic components of bone induced by local thermal gradients during FIB milling and SEM imaging.
Figure 4.

(a) Overview HAADF-STEM image of the electron transparent lamella where BG and bone regions can be distinguished. Bone ingrowth into a dissolving crevice in the BG is marked by the white star. (b) Bone–BG interface resolved at the nanoscale. The interfacial layer (marked by arrows) is around 120–200 nm in thickness, and appears to be gradual, formed both by the dissolution of BG and the generation of new bone. Areas of likely BG ongoing dissolution are indicated by black stars.
3.4. Nanoscale characterization of the interface
For the first time, the bone–BG interface was characterized at the nanoscale by HAADF-STEM imaging (figure 4). Although some early TEM studies showed osseointegrated BG particles in a rat femur [31], HAADF-STEM provided an unprecedented resolution of the bone–BG interface, not present in any other work. Thanks to the Z-contrast sensitivity of the HAADF detector [11], BG and bone were readily distinguishable as the higher atomic mass of BG caused more scattering of the electron beam, resulting in brighter intensity compared to bone. Not only did STEM confirm that bone was growing in close contact to BG as appeared from BSE imaging, but it made it possible to appreciate the gradual nature of the interface, or better, the interphase, formed both by the dissolution of BG and deposition of new bone (figure 4b). Such visualization of the interphase was not possible in previous work [31], as TEM imaging is not suitable to visualize compositional gradients, which instead can be clearly distinguished thanks to Z-contrast in HAADF-STEM. The presence of said interphase is compatible to the osteoconduction mechanism of BG in vivo [21]. As BG is exposed to body fluids, interfacial ion exchange leads to the formation of a Si-rich core and Ca/P-rich outer layer, which promotes the differentiation of primitive cells into osteoblasts [21,26]. The naturally formed biointerphase between BG and bone displayed varying thickness, from around 120 nm to 200 nm, due to the simultaneous dissolution of BG and reprecipitation of bone mineral at the interface [25]. Despite BG's current use in clinical practice, there is a lack of studies on its bioactive behaviour at the nanoscale. However, since bone formation begins at the nanoscale, the concept of osseointegration has evolved over time to become ‘nano-osseointegration’ [15,27,32]. This term emphasizes the value of high-resolution visualization of bone–biomaterial interfaces for a deeper understanding of the mechanisms behind bone growth and bone bonding, as well as of the changes occurring in the biomaterial in vivo. In the case of BG, nanoscale imaging enabled the resolution of the gradual biointerphase at its surface, not discernible with other techniques such as SEM. This was important to confirm its osteoconduction properties at the length scale where osseointegration begins. The HAADF-STEM characterization of nanoscale osseointegration of BG reported herein displayed similar results to what was previously shown for hydroxyapatite scaffolds [30]. Similar interfacial gradients and dissolution profiles have also been reported in TEM for other hydroxyapatite-based biomaterials, such as silicon-substituted hydroxyapatite [33], and carbonated hydroxyapatite [34]. TEM has also been used to characterize sub-micrometric particles of bioactive glass undergoing dissolution in simulated body fluid in vitro [35].
STEM imaging also resolved the nanoscale structure, i.e. the ultrastructure, of new bone forming in the vicinity of BG. Said ultrastructure is compatible to that of woven bone, as expected, since limited remodelling had presumably occurred given the early implant retrieval time point of 30 days.
3.5. Three-dimensional reconstruction of the interface
From the 68 HAADF-STEM images acquired at different tilt angles, an electron tomogram of around 1231 × 1494 × 161 nm3 in volume was reconstructed and the tomogram is shown in figure 5 in coloured volume rendering. Inspection of 2D orthogonal slices throughout the reconstructed volume, one shown in figure 6a, confirmed that the bone–BG interface was continuous along the whole thickness of the sample, and not the result of feature overlap arising from 2D projections in STEM imaging. Visualization of individual orthoslices also enabled better identification of collagen fibres within newly formed bone. These were already distinguishable in HAADF-STEM images, but less clearly due to the overlapping of the mineral phase projected onto the same imaging plane. Analogously to what has been observed for other bone-interfacing materials [30,32,36], collagen fibres appeared to be aligned parallel to the interface with BG, as can be inferred from the dark circles oriented perpendicular to the plane of the page (figure 6a). This can be further assessed from the volume rendering in figure 6b, where the colourmap was selected to better highlight the collagen fibres. In the electronic supplementary material, we provide a video (electronic supplementary material, video S1) of the reconstructed 3D volume containing both the volume-rendered reconstruction and an animation slicing through the volume in the z (thickness) direction.
Figure 5.
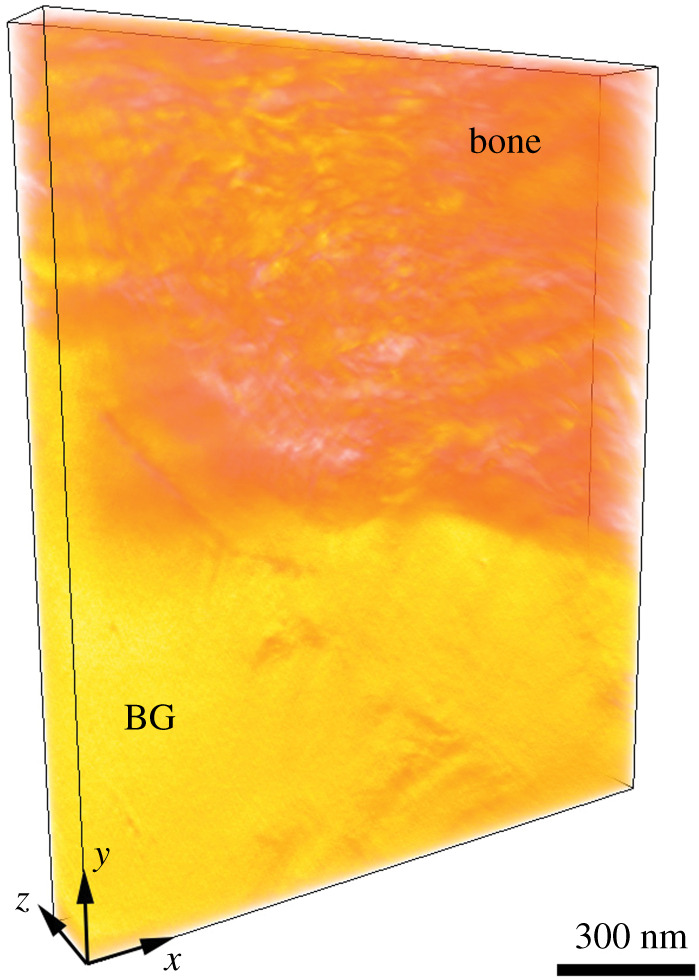
Volume rendering of the bone–BG interface. The volume is false-coloured such that the yellow and orange areas correspond to BG and bone, respectively. The dimensions of the volume are (1231 nm, 1494 nm, 161 nm) in (x, y, z). An approximate scale bar is added.
Figure 6.

(a) Orthoslice representing the bone–BG interface in the x–y plane. The dark circles indicated in white correspond to collagen fibres. As these are oriented perpendicular to the plane of the page, they result to be parallel to the bone–BG interface. (b) Volume rendering of the bone–BG interface, where the colourmap and opacity were adjusted to segment the collagen fibres (blue). This allowed to better observe that collagen fibres were oriented parallel to the interface (inset), as suggested in (a). Pink regions correspond to BG and areas of higher mineralization in bone. The dimensions of the volume are (1231 nm, 1494 nm, 161 nm) in (x, y, z). An approximate scale bar is provided in (b).
4. Conclusion
Resolving the bone–BG interface at the nanoscale can shed new light on the osseointegration process for this biomaterial. However, producing a thin intact interfacial sample is challenging via conventional preparation approaches, and usual high-resolution imaging neglects to analyse the 3D nature of bone interphases with biomaterials.
The following workflow reported herein resolved the bone–BG interface at the nanoscale and in 3D. Specifically:
-
—
BSE imaging identified areas of new bone contact with BG;
-
—
FIB in situ lift-out obtained an electron transparent TEM sample, while preserving an intact BG–bone interface;
-
—
HAADF-STEM unveiled the bone–BG interface with nanoscale resolution, revealing the gradual nature of the interface, a biointerphase and the presence of collagen fibres oriented parallel to the BG surface; and
-
—
ET confirmed the organization of the interface and the ultrastructure of new bone in 3D, excluding structural artefacts that arise from the projection nature of 2D STEM images.
This workflow becomes especially relevant as a tool to assess the role of surface-modified BG or its use under different bone healing conditions, such as in compromised or pathological bone, in the future.
Acknowledgements
Microscopy was performed at the Canadian Centre for Electron Microscopy (CCEM) at McMaster University, a facility supported by the Natural Sciences and Engineering Research Council of Canada (NSERC) and other government agencies.
Ethics
The in vivo study was approved by the Ethics Committee on the Use of Animals (CEUA) at the São Paulo State University (Araçatuba, SP, Brazil) (Process FOA no. 2017-00199). A total of 80 male Wistar rats were employed in the study, but only one animal was used for the analyses reported in this paper. The study was conducted following the ARRIVE guidelines (Animal Research: Reporting of In Vivo Experiments) [37].
Data accessibility
The data used in this work are provided either in the paper or in the electronic supplementary material [38].
Authors' contributions
This paper has multiple authors and our individual contributions were as below: C.M.: conceptualization, investigation, methodology, writing—original draft; P.H.S.G.-F.: conceptualization, investigation, writing—review and editing; T.C.: methodology, writing—review and editing; P.N.L.-F.: conceptualization, funding acquisition, supervision, writing—review and editing; R.O.: conceptualization, funding acquisition, supervision, writing—review and editing; K.G.: conceptualization, funding acquisition, supervision, writing—review and editing.
Competing interests
We declare we have no competing interests.
Funding
This work was supported by CAPES (UNESP/CAPES/Print Project), the São Paulo Research Foundation (FAPESP) (process number: 2017/08187-3), the Natural Sciences and Engineering Research Council of Canada (NSERC) (RGPIN-2020-05722), the Ontario Ministry of Research, Science and Innovation (Early Researcher Award ER17-13-081) and the Canada Research Chairs Programme.
References
- 1.Albrektsson T, Brånemark P-I, Hansson H-A, Lindström J. 1981Osseointegrated titanium implants: requirements for ensuring a long-lasting, direct bone-to-implant anchorage in man. Acta Orthop. Scand. 52, 155-170. ( 10.3109/17453678108991776) [DOI] [PubMed] [Google Scholar]
- 2.Pearce A, Richards R, Milz S, Schneider E, Pearce S. 2007Animal models for implant biomaterial research in bone: a review. Eur. Cells Mater. 13, 1-10. ( 10.22203/eCM.v013a01) [DOI] [PubMed] [Google Scholar]
- 3.Wancket LM. 2015Animal models for evaluation of bone implants and devices. Vet. Pathol. 52, 842-850. ( 10.1177/0300985815593124) [DOI] [PubMed] [Google Scholar]
- 4.Binkley DM, Grandfield K. 2017Advances in multiscale characterization techniques of bone and biomaterials interfaces. ACS Biomater. Sci. Eng. 4, 3678-3690. ( 10.1021/acsbiomaterials.7b00420) [DOI] [PubMed] [Google Scholar]
- 5.Palmquist A. 2018A multiscale analytical approach to evaluate osseointegration. J. Mater. Sci. Mater. Med. 29, 60. ( 10.1007/s10856-018-6068-y) [DOI] [PMC free article] [PubMed] [Google Scholar]
- 6.Reznikov N, Shahar R, Weiner S. 2014Bone hierarchical structure in three dimensions. Acta Biomater. 10, 3815-3826. ( 10.1016/j.actbio.2014.05.024) [DOI] [PubMed] [Google Scholar]
- 7.Shah FA, Thomsen P, Palmquist A. 2018Osseointegration and current interpretations of the bone-implant interface. Acta Biomater. 84, 1-15. ( 10.1016/j.actbio.2018.11.018) [DOI] [PubMed] [Google Scholar]
- 8.Clarke B. 2008Normal bone anatomy and physiology. Clin. J. Am. Soc. Nephrol. 3, S131-S139. ( 10.2215/CJN.04151206) [DOI] [PMC free article] [PubMed] [Google Scholar]
- 9.Linder L, Albrektsson T, Branemark P-I, Hansson H-A, Ivarsson B, Jonsson U, Lundstrom I. 1983Electron microscopic analysis of the bone-titanium interface. Acta Orthop. Scand. 54, 45-52. ( 10.3109/17453678308992868) [DOI] [PubMed] [Google Scholar]
- 10.Tracy BM, Doremus RH. 1984Direct electron microscopy studies of the bone–hydroxylapatite interface. J. Biomed. Mater. Res. 18, 719-726. ( 10.1002/jbm.820180702) [DOI] [PubMed] [Google Scholar]
- 11.Carter CB, Williams DB (eds). 2016. Imaging in STEM. Transmission electron microscopy diffraction, imaging and spectrometry. New York, NY: Springer. [Google Scholar]
- 12.Giannuzzi LA, Giannuzzi NJ, Capuano MJ. 2005FIB, SEM, and TEM of bone/dental implant interfaces. Microsc. Microanal. 11, 998-999. ( 10.1017/s1431927605508225) [DOI] [Google Scholar]
- 13.Engqvist H, Botton GA, Couillard M, Mohammadi S, Malmström J, Emanuelsson L, Hermansson L, Phaneuf MW, Thomsen P. 2006A novel tool for high-resolution transmission electron microscopy of intact interfaces between bone and metallic implants. J. Biomed. Mater. Res. A 78A, 20-24. ( 10.1002/jbm.a.30696) [DOI] [PubMed] [Google Scholar]
- 14.Grandfield K, Engqvist H. 2012Focused ion beam in the study of biomaterials and biological matter. Adv. Mater. Sci. Eng. 2012, 841961. ( 10.1155/2012/841961) [DOI] [Google Scholar]
- 15.Palmquist A, Grandfield K, Norlindh B, Mattsson T, Brånemark R, Thomsen P. 2012Bone–titanium oxide interface in humans revealed by transmission electron microscopy and electron tomography. J. R. Soc. Interface 9, 396-400. ( 10.1098/rsif.2011.0420) [DOI] [PMC free article] [PubMed] [Google Scholar]
- 16.Wang X, Shah FA, Palmquist A, Grandfield K. 20163D characterization of human nano-osseointegration by on-axis electron tomography without the missing wedge. ACS Biomater. Sci. Eng. 3, 49-55. ( 10.1021/acsbiomaterials.6b00519) [DOI] [PubMed] [Google Scholar]
- 17.Ercius P, Alaidi O, Rames MJ, Ren G. 2015Electron tomography: a three-dimensional analytic tool for hard and soft materials research. Adv. Mater. 27, 5638-5663. ( 10.1002/adma.201501015) [DOI] [PMC free article] [PubMed] [Google Scholar]
- 18.Frank J. 2006Electron tomography, methods for three-dimensional visualization of structures in the cell. New York, NY: Springer. [Google Scholar]
- 19.Grandfield K, Palmquist A, Engqvist H. 2012High-resolution three-dimensional probes of biomaterials and their interfaces. Phil. Trans. R. Soc. A 370, 1337-1351. ( 10.1098/rsta.2011.0253) [DOI] [PubMed] [Google Scholar]
- 20.Furusawa T, Mizunuma K. 1997Osteoconductive properties and efficacy of resorbable bioactive glass as a bone-grafting material. Implant Dent. 6, 93-101. ( 10.1097/00008505-199700620-00003) [DOI] [PubMed] [Google Scholar]
- 21.Schepers E, Clercq MD, Ducheyene P, Kempeneers P. 1991Bioactive glass particulate material as a filler for bone lesions. J. Oral Rehabil. 18, 439-452. ( 10.1111/j.1365-2842.1991.tb01689.x) [DOI] [PubMed] [Google Scholar]
- 22.Gomes-Ferreira PHS, et al. 2019Sonochemical time standardization for bioactive materials used in perimplantar defects filling. Ultrason. Sonochem. 56, 437-446. ( 10.1016/j.ultsonch.2019.04.032) [DOI] [PubMed] [Google Scholar]
- 23.Radermacher M. 1988Three-dimensional reconstruction of single particles from random and nonrandom tilt series. J. Electron Microsc. Tech. 9, 359-394. ( 10.1002/jemt.1060090405) [DOI] [PubMed] [Google Scholar]
- 24.Goldstein JI, Newbury DE, Michael JR, Ritchie NWM, Scott JHJ, Joy DC. 2018Scanning electron microscopy and X-ray microanalysis. New York, NY: Springer. [Google Scholar]
- 25.Ducheyne P, Qiu Q. 1999Bioactive ceramics: the effect of surface reactivity on bone formation and bone cell function. Biomaterials 20, 2287-2303. ( 10.1016/S0142-9612(99)00181-7) [DOI] [PubMed] [Google Scholar]
- 26.Schepers EJG, Ducheyne P, Barbier L, Schepers S. 1993Bioactive glass particles of narrow size range: a new material for the repair of bone defects. Implant Dent. 2, 151-156. ( 10.1097/00008505-199309000-00025) [DOI] [PubMed] [Google Scholar]
- 27.Grandfield K. 2015Bone, implants, and their interfaces. Phys. Today 68, 40-45. ( 10.1063/PT.3.2748) [DOI] [Google Scholar]
- 28.Karreman MA, et al. 2017Find your way with X-ray using microCT to correlate in vivo imaging with 3D electron microscopy. In Methods in cell biology (eds Müller-Reichert T, Verkade P), pp. 277-301. Cambridge, MA:Academic Press. [DOI] [PubMed] [Google Scholar]
- 29.Starborg T, O'Sullivan JDB, Carneiro CM, Behnsen J, Else KJ, Grencis RK, Withers PJ. 2019Experimental steering of electron microscopy studies using prior X-ray computed tomography. Ultramicroscopy 201, 58-67. ( 10.1016/j.ultramic.2019.03.002) [DOI] [PMC free article] [PubMed] [Google Scholar]
- 30.Grandfield K, et al. 2012Bone response to free-form fabricated hydroxyapatite and zirconia scaffolds: a transmission electron microscopy study in the human maxilla. Clin. Implant Dent. Relat. Res. 14, 461-469. ( 10.1111/j.1708-8208.2009.00270.x) [DOI] [PubMed] [Google Scholar]
- 31.Hench LL, Paschall HA. 1973Direct chemical bond of bioactive glass-ceramic materials to bone and muscle. J. Biomed. Mater. Res. 4, 25-42. ( 10.1002/jbm.820070304) [DOI] [PubMed] [Google Scholar]
- 32.Grandfield K, Gustafsson S, Palmquist A. 2013Where bone meets implant: the characterization of nano-osseointegration. Nanoscale 5, 4302-4308. ( 10.1039/c3nr00826f) [DOI] [PubMed] [Google Scholar]
- 33.Porter AE, Patel N, Skepper JN, Best SM, Bonfield W. 2003Comparison of in vivo dissolution processes in hydroxyapatite and silicon-substituted hydroxyapatite bioceramics. Biomaterials 24, 4609-4620. ( 10.1016/S0142-9612(03)00355-7) [DOI] [PubMed] [Google Scholar]
- 34.Porter A, Patel N, Brooks R, Best S, Rushton N, Bonfield W. 2005Effect of carbonate substitution on the ultrastructural characteristics of hydroxyapatite implants. J. Mater. Sci. Mater. Med. 16, 899-907. ( 10.1007/s10856-005-4424-1) [DOI] [PubMed] [Google Scholar]
- 35.Labbaf S, Tsigkou O, Müller KH, Stevens MM, Porter AE, Jones JR. 2011Spherical bioactive glass particles and their interaction with human mesenchymal stem cells in vitro. Biomaterials 32, 1010-1018. ( 10.1016/j.biomaterials.2010.08.082) [DOI] [PubMed] [Google Scholar]
- 36.Grandfield K, Palmquist A, Engqvist H. 2013Three-dimensional structure of laser-modified Ti6Al4 V and bone interface revealed with STEM tomography. Ultramicroscopy 127, 48-52. ( 10.1016/j.ultramic.2012.07.007) [DOI] [PubMed] [Google Scholar]
- 37.Percie du Ser N, et al. 2020The ARRIVE guidelines 2.0: updated guidelines for reporting animal research. PLoS Biol. 18, e3000410. ( 10.1371/journal.pbio.3000410) [DOI] [PMC free article] [PubMed] [Google Scholar]
- 38.Micheletti C, Gomes-Ferreira PHS, Casagrande T, Lisboa-Filho PN, Okamoto R, Grandfield K. 2021From tissue retrieval to electron tomography: nanoscale characterization of the interface between bone and bioactive glass. Figshare. [DOI] [PMC free article] [PubMed]
Associated Data
This section collects any data citations, data availability statements, or supplementary materials included in this article.
Data Citations
- Micheletti C, Gomes-Ferreira PHS, Casagrande T, Lisboa-Filho PN, Okamoto R, Grandfield K. 2021From tissue retrieval to electron tomography: nanoscale characterization of the interface between bone and bioactive glass. Figshare. [DOI] [PMC free article] [PubMed]
Data Availability Statement
The data used in this work are provided either in the paper or in the electronic supplementary material [38].