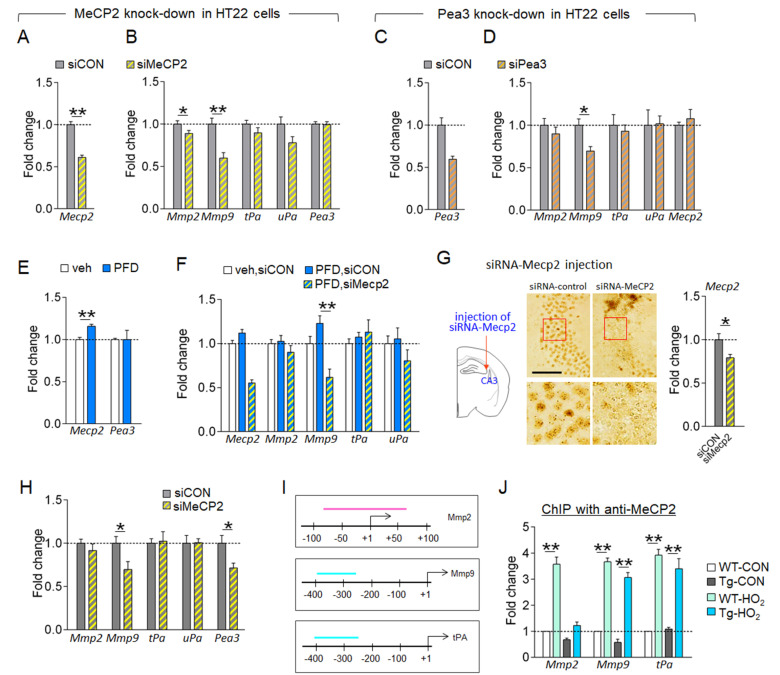
Fig. 5.
Hyperoxygenation condition increased the expression of MMP-9 via MeCP2 in HT22 cells. (A~D) Expression levels of Mecp2, Pea3, Mmp-2, Mmp-9, tPA, and uPA genes in HT22 cells treated with siRNA-MeCP2 (A, B) or siRNA-Pea3 (C, D). siCON, siRNA-control; siMeCP2, siRNA-MeCP2; siPea3, siRNA-Pea3. n=6 wells, 4~12 repeats. (E) Expression levels of Mecp2 and Pea3 in HT22 cells treated with 20% PFD. Veh, vehicle. n=6 wells, 4~6 repeats. (F) Expression levels of Mecp2, Mmp-2, Mmp-9, tPA, and uPA in HT22 cells treated with 20% PFD plus siRNA-MeCP2 or siRNA-control. n=6 wells, 5~7 repeats. (G, H) Photomicrographs showing siRNA-mediated knockdown of MeCP2 in the CA3 of mice. High magnification of boxed areas (G, bottom panels). Transcript levels of Mecp2 in siRNA-Mecp2 injection site (G, right). Diagram showing the siRNA-Mecp2 injection site (G, left). Expression levels (H) of the Mmp-2, Mmp-9, tPA, uPA, and Pea3 in siRNA-Mecp2 injection site. siCON, siRNA-control. Scale bar, 20 μm. n=6 animals/group, 4~8 repeats. (I, J) The proximal promoter regions (I) of the Mmp-2, Mmp-9, and tPA genes and the locations (the colored bar in each promoter) used for qPCR amplification in ChIP assay. ChIP-qPCR data (J) showing MeCP2 binding levels to the promoter of the Mmp-2, Mmp-9, and tPA in the hippocampus of WT-CON, WT-HO2, Tg-CON, and Tg-HO2 mice. HO2 treatment was depicted in Fig. 4B. n=7~11 animals/group, 5~6 repeats. Data are presented as mean±SEM. *,**difference between indicated groups. *p<0.05; **p<0.01 (Student’s t-test; one-way ANOVA and Newman–Keuls post hoc test; two-way ANOVA and Bonferroni post hoc test).

