Fig. 3.
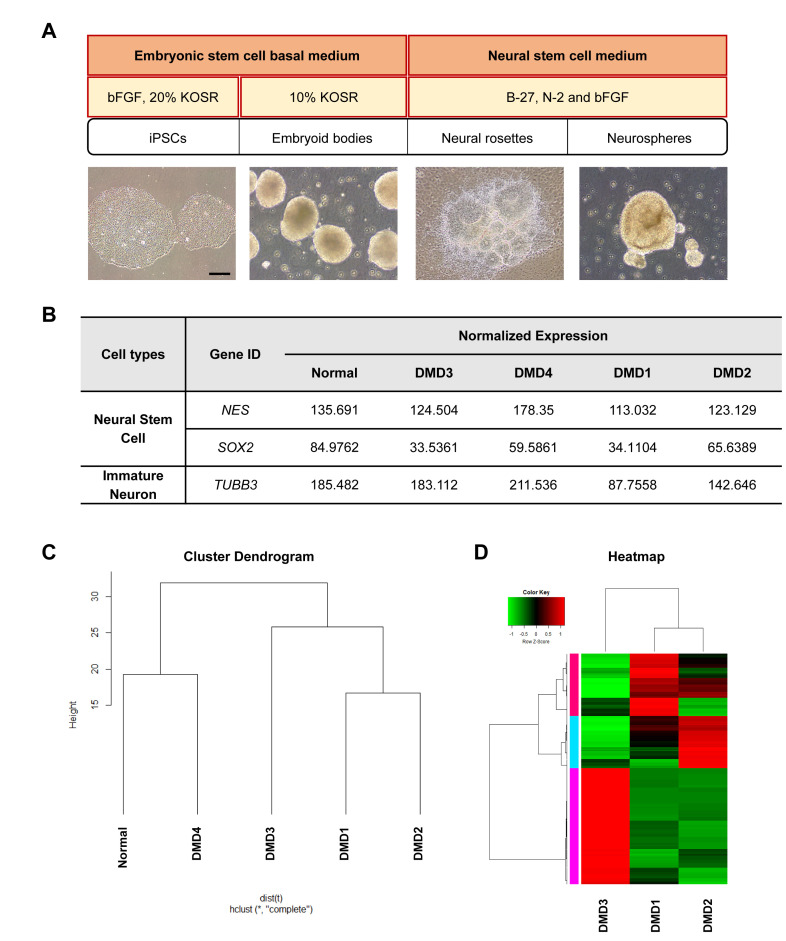
Gene expression patterns of NSCs differ between DMD patients with and without ID. (A) Schematic diagram shows overall procedure of NSC formation from iPSCs. bFGF, basic fibroblast growth factor; KOSR, knockout serum replacement. (B) RNA-seq data show that NSC marker NES was well expressed in NSCs derived from all individuals, whereas the mRNA level of the marker for early-stage neurons (TUBB3) was lower in the individuals with DMD with ID (DMD1 and DMD2) than in those without ID (normal, DMD3, and DMD4). (C) Cluster dendrogram shows that DMD patients with ID (DMD1 and DMD2) clustered separately from the individuals without ID. (D) Heatmap shows differential gene expression pattern between those with ID (DMD1 and DMD2) and the DMD patient without ID (DMD3). Scale bar: (A) 100 μm.

