
Figure 1 .
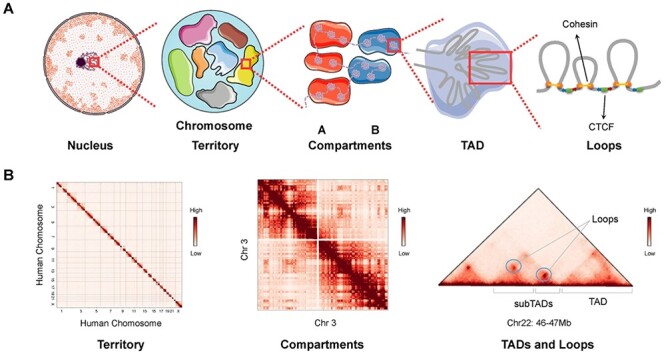
Hierarchical genome organization. (A) Multilevel 3D genome organizations. Chromosome territory, compartments, TADs and loops can be observed from left to right. Each chromosome territory is denoted by different colors. Compartment A and B are indicated by red and blue background, respectively. TADs are formed by LE. The ring-shaped cohesin squeeze the chromatin into loops and halt when they encounter the boundary elements CTCF in the specific orientation (indicated by the blue and red arrows) at two sites of cohesin ring. (B) Hi-C matrices of hierarchical chromatin organizations. Interchromosomal interaction between human chromosomes presents the organization of chromosome territories. Intrachromosomal interaction between chromosome 3 indicates the chromatin compartments. Matrix of a 1 Mb width subregion on chromosome 22 shows TADs, subTADs and loops, which are denoted as punctate signals. Hi-C matrices in panel B are generated from Rao’s (access code GSE63525) Hi-C data in GM12878 cell line.