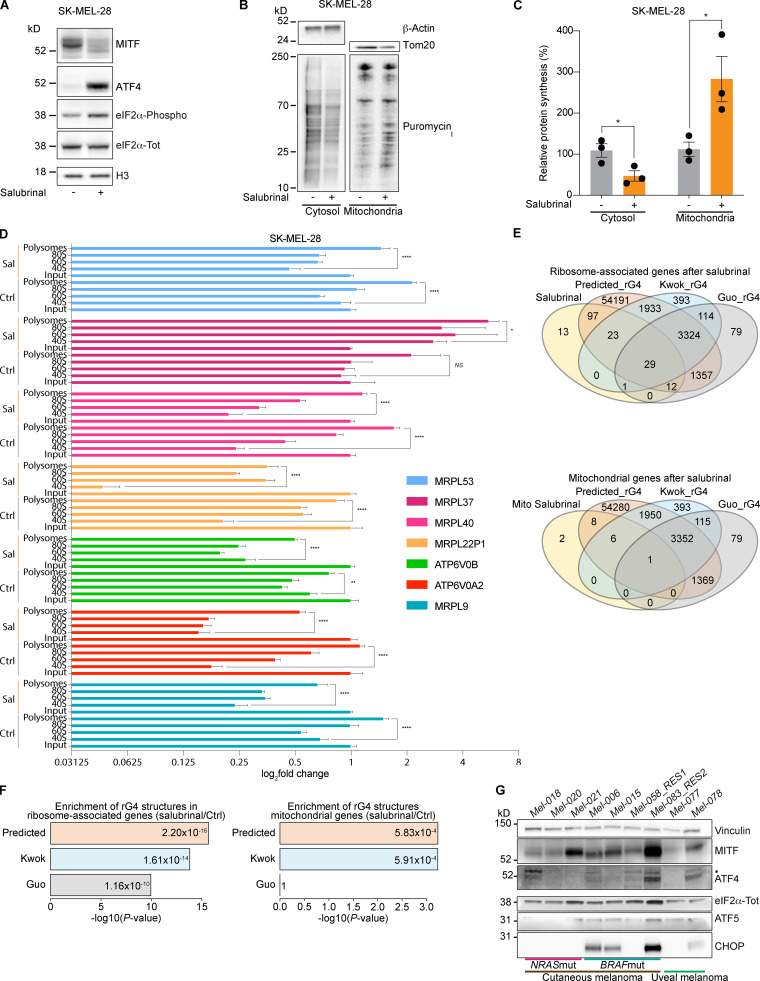
Figure 1.
Activation of the ISR increases mitochondrial translation. (A) Western blotting of SK-MEL-28 cells 72 h after treatment with salubrinal (+, 20 µM) or DMSO (–). Representative images of three independent experiments. (B) Western blotting of cells described in A, after a 10-min pulse with puromycin (10 µM) and subsequent cytosol-mitochondria fractionation. Representative images of three independent experiments. (C) Quantification of protein synthesis (%), measured by calculating the intensity of the puromycin signal on western blot, in SK-MEL-28 cells as described in B. Data are mean ± SEM of three different biological replicates. *, P < 0.05 by Student’s t test. (D) RT-qPCR of cells described in A and Fig. S1 A for mitochondrial encoded genes. Ctrl, DMSO; Sal, salubrinal. Error bars represent mean ± SD of three independent experiments. NS, P > 0.05; *, P < 0.05; **, P < 0.01; ****, P < 0.0001 by Dunnett’s test. (E) Intersection of total ribosome-associated mRNAs (top) or mitochondrial mRNAs (bottom) after treatment with salubrinal and genes containing RNA rG4 structures in their mRNA in the entire genome, as predicted by using the QGRS Mapper tool (Kikin et al., 2006) and the Kwok (Kwok et al., 2016) and Guo (Guo and Bartel, 2016) datasets of experimentally validated rG4s. (F) Enrichment in rG4 elements in the mitochondrial (right) or total (left) mRNA associated with ribosomes after treatment with salubrinal. The displayed enrichment was calculated by comparing the proportion of rG4s in these two sets of transcripts with the proportion of rG4s in the whole transcriptome as predicted by QGRSMapper (Predicted_rG4) or experimentally validated (Kwok_rG4 and Guo_rG4). P values were calculated by Fisher’s test (Benjamini–Hochberg corrected value). (G) Western blotting of a panel of drug-naive melanoma PDX models. Mut, mutant; RES1, resistant to BRAFi; RES2, resistant to BRAFi + MEKi and anti-PD-1 + anti-CTLA-4; •, ATF4 band.

