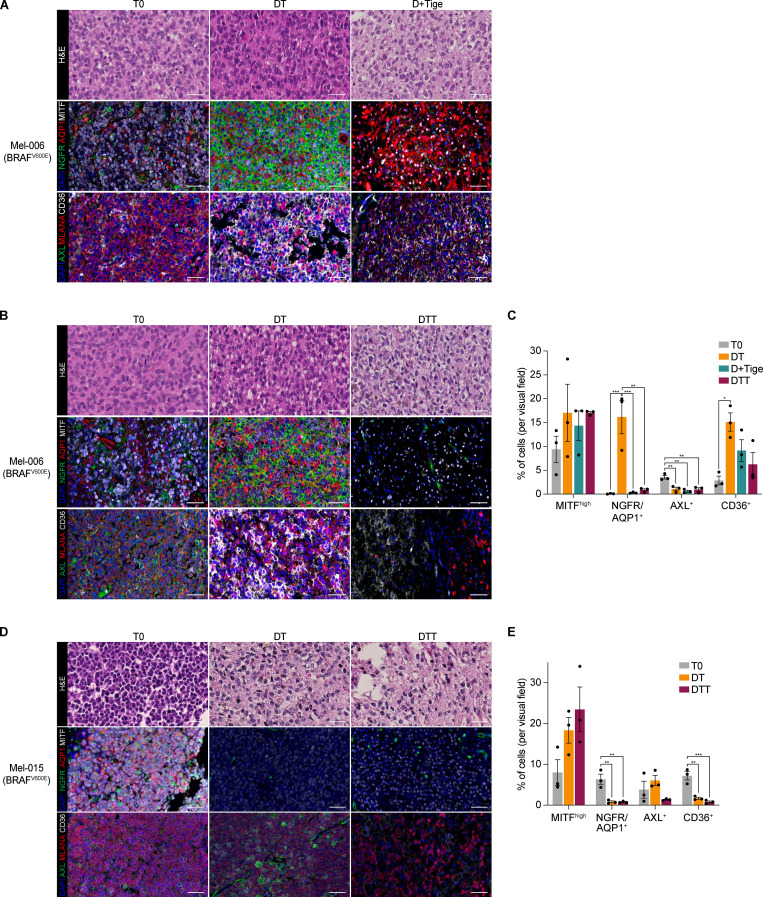
Figure 4.
Tigecycline efficiently suppresses known drug-resistant cell populations. (A) Top: Representative H&E staining of Mel-006 BRAFV600E PDX tumors before treatment (T0, left), upon treatment with MAPKis at MRD (DT, middle), and upon treatment with dabrafenib and tigecycline (D + Tige, right) at MRD. Middle: Representative immunofluorescence staining against MITF (white), NGFR (green), and AQP1 (red) before treatment (T0) and at MRD of DT and D-Tige lesions. Bottom: Representative immunofluorescence staining against CD36 (white), AXL (green), and Melan-A (MLANA; red) before treatment (T0) and at MRD of DT and D-Tige lesions. Slides were counterstained with DAPI (blue). Scale bar = 50 µm. (B) Top: Representative H&E staining of Mel-006 BRAFV600E PDX tumors before treatment (T0, left), upon treatment at MRD with MAPKis (DT, middle), and upon treatment with DTT (right). Middle: Representative immunofluorescence staining against MITF (white), NGFR (green), and AQP1 (red) before treatment (T0) and at MRD of DT and DTT lesions. Bottom: Representative immunofluorescence staining against CD36 (white), AXL (green), and MLANA (red) before treatment (T0) and at MRD of DT and DTT lesions. Slides were counterstained with DAPI (blue). Scale bar = 50 µm. (C) Quantification of the immunostainings described in A and B presented as the mean percentage of positive cells per visual field per each antibody ± SEM of three independent experiments. *, P < 0.05; **, P < 0.01; ***, P < 0.001 by one-way ANOVA with Tukey’s multiple comparisons test. (D) Top: Representative H&E staining of Mel-015 BRAFV600E PDX tumors before treatment (T0, left), upon treatment at MRD with MAPK inhibitors (DT, middle), and upon treatment with DTT (right). Middle: Representative immunofluorescence staining against MITF (white), NGFR (green), and AQP1 (red) before treatment (T0) and at MRD of DT and DTT lesions. Bottom: Representative immunofluorescence staining against CD36 (white), AXL (green), and MLANA (red) before treatment (T0) and at MRD of DT and DTT lesions. Slides were counterstained with DAPI (blue). Scale bar = 50 µm. (E) Quantification of the immunostainings described in D presented as the mean percentage of positive cells per visual field per each antibody ± SEM of three independent experiments. **, P < 0.01; ***, P < 0.001 by one-way ANOVA with Tukey’s multiple comparisons test.

