Figure S2.
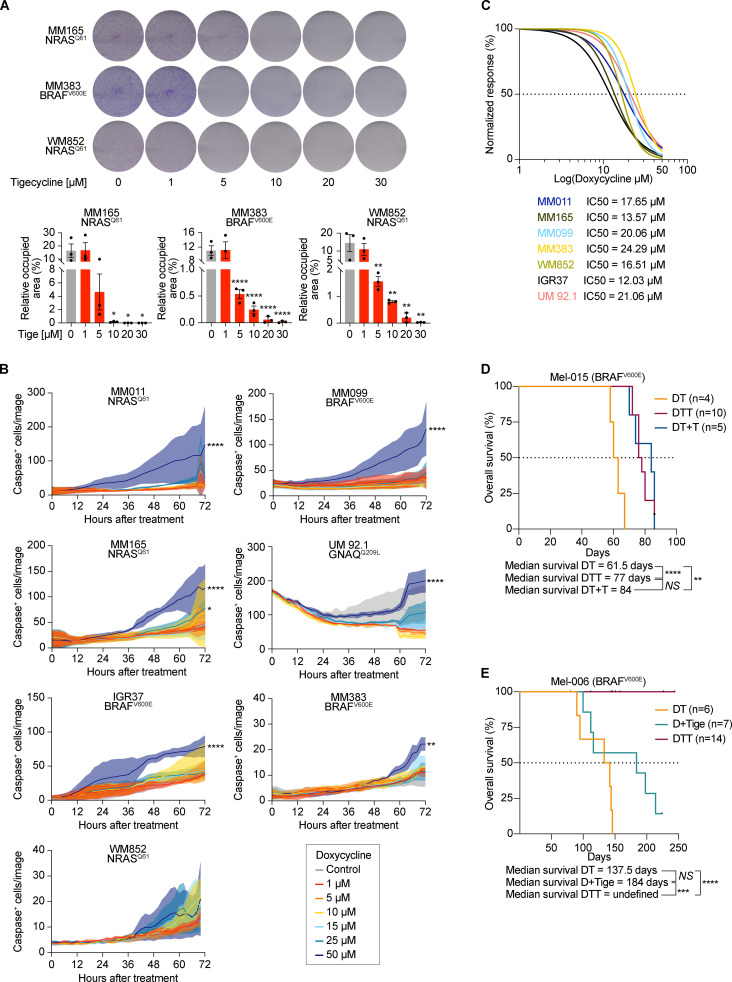
Tetracyclines affect the growth of multiple drug–tolerant states. (A) Top: Colony formation assays with cells described in Fig. 3 A. The violet color is due to crystal violet, a compound that binds intracellular DNA and protein, thus highlighting the cells attached to the plate. Representative image of three independent experiments. Bottom: Quantification of colony formation assays of cells described in top panel presented as the mean density (percentage of area occupancy) ± SEM of three independent experiments. *, P < 0.05; **, P < 0.01; ****, P < 0.0001 by Dunnett’s test. (B) Caspase activity (measured as average number of caspase+ cells per image) of cells described in Figs. 2 B and 5 B. Data are presented as mean ± SEM of three independent experiments. *, P < 0.05; **, P < 0.01; ****, P < 0.0001 by Dunnett’s test. (C) Growth inhibition curves and half-maximal inhibitory concentration (IC50) values of several cutaneous melanoma cell lines and one UM (92.1) cell line upon exposure to increasing concentrations of doxycycline. Data are mean ± SEM of three independent experiments. (D) Kaplan–Meier plot showing OS of mice described in Fig. 3 A. DT (n = 4), DTT (n = 10), dabrafenib + trametinib with the addition of tigecycline at MRD (DT + T, n = 5). NS, P > 0.05; **, P < 0.01; ****, P < 0.0001 by log-rank (Mantel–Cox) test. (E) Kaplan–Meier plot showing OS of mice described in Fig. 3 C. DT (n = 6), D + Tige, n = 7), DTT (n = 14). NS, P > 0.05; ***, P < 0.001; ****, P < 0.0001 by log-rank (Mantel–Cox) test.

