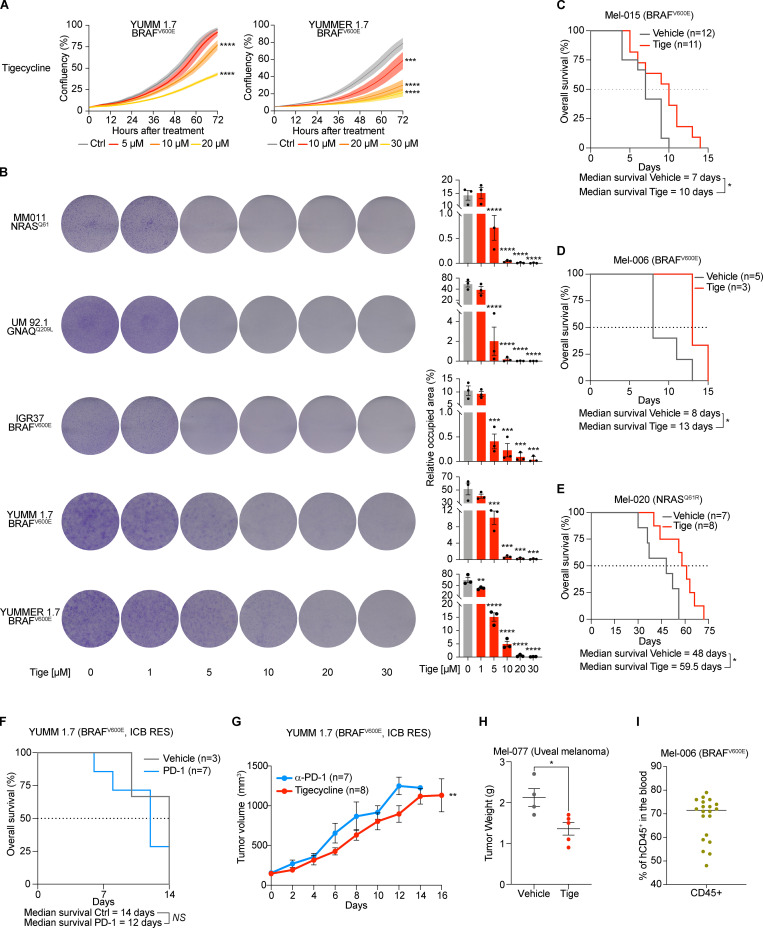
Figure S4.
Tigecycline restrains the growth of BRAF WT and ICB-resistant melanomas and increases OS. (A) Cell growth (measured as percentage of cell confluency) of YUMM 1.7 (resistant to immunotherapy) and YUMMER 1.7 (immunotherapy-sensitive) cell lines upon exposure to increasing concentrations of tigecycline for 72 h. Data are mean ± SEM of three independent experiments. ***, P < 0.001; ****, P < 0.0001 by Dunnett’s test. (B) Left: Colony formation assays with cells described in Fig. 2 A and A treated with increasing concentrations of tigecycline. The violet color is due to crystal violet, a compound that binds intracellular DNA and protein, thus highlighting the cells attached to the plate. Representative image of three independent experiments. Right: Quantification of colony formation assays of cells described in Fig. 2 A and A presented as the mean density (percentage of area occupancy) ± SEM of three independent experiments. **, P < 0.01; ***, P < 0.001; ****, P < 0.0001 by Dunnett’s test. (C) Kaplan–Meier plot showing OS of Mel-015 BRAFV600E PDX mice treated with vehicle (DMSO, n = 12) or tigecycline (n = 11). *, P < 0.05 by log-rank (Mantel–Cox) test. (D) Kaplan–Meier plot showing OS of Mel-006 BRAFV600E PDX mice treated with vehicle (DMSO, n = 5) or tigecycline (n = 3). *, P < 0.05 by log-rank (Mantel–Cox) test. (E) Kaplan–Meier plot showing OS of mice described in Fig. 5 C. Vehicle (DMSO, n = 7) or tigecycline (n = 8). *, P < 0.05 by log-rank (Mantel–Cox) test. (F) Kaplan–Meier plot showing OS of YUMM 1.7 mouse xenografts treated with α-PD-1 (n = 7) or vehicle (n = 3). NS, P > 0.5 by log-rank (Mantel–Cox) test. ICB RES, ICB resistant. (G) Tumor volume of cohorts of YUMM 1.7 (BRAFV600E) mouse xenografts treated with α-PD-1 (n = 7) or tigecycline (n = 8). Data are mean ± SEM of different biological replicates. **, P < 0.01 by two-way ANOVA. (H) Tumor weight of Mel-077 cohorts of mice described in Fig. 5 E. Vehicle (DMSO, n = 4), tigecycline (n = 5). *, P < 0.05 by Student’s t test. (I) Percentage of human CD45 positive (hCD45+) in the blood of Mel-006 mice described in Fig. 5 F. n = 19.

