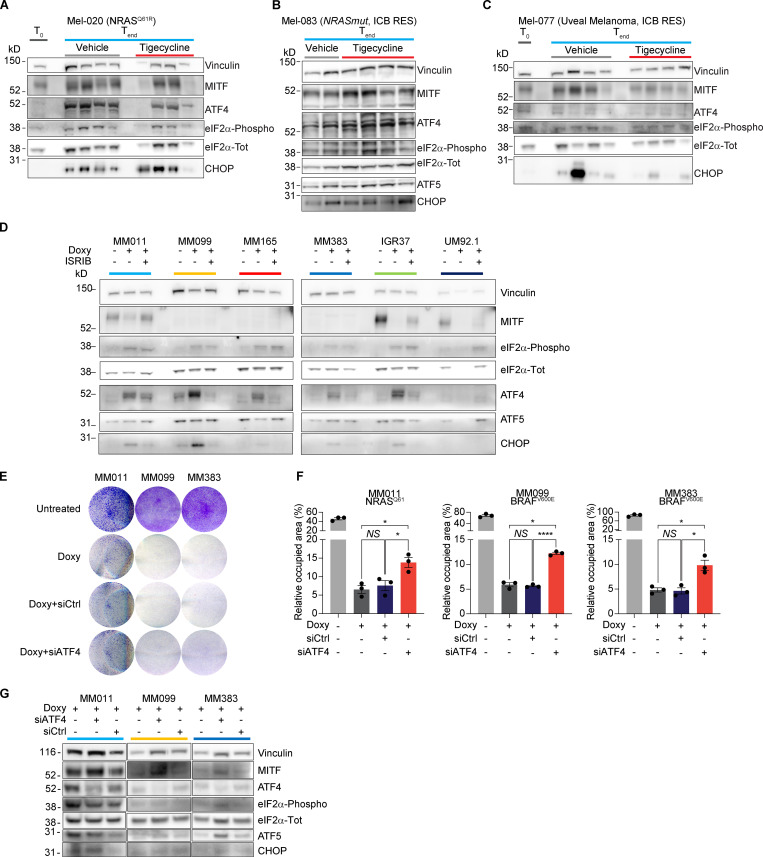
Figure S5.
Activation of the ISR predicts durable responses to antibiotic treatment. (A) Western blotting of Mel-020 (NRASQ61R) PDX tumors described in Fig. 5 C collected right before the start of the treatment (T0) or at the end of the experiment (Tend) after receiving a daily dose of vehicle or tigecycline. (B) Western blotting of Mel-083 (NRAS mutant, ICB resistant) PDX tumors described in Fig. 5 D. (C) Western blotting of Mel-077 (UM) PDX tumors described in Fig. 5 E collected right before the start of the treatment (T0) or at the end of the experiment (Tend) after receiving a daily dose of vehicle or tigecycline. (D) Western blotting of cells described in Fig. 6 C. Representative image of three independent experiments. (E) Colony formation assays of MM011 (NRASQ61), MM099 (BRAFV600E), and MM383 (BRAFV600E) cells treated with doxycycline (Doxy, 37.5 µM) and transfected with either a control siRNA (siCtrl, 20 nM) or an siRNA targeting ATF4 (siATF4, 20 nM) or untreated for 72 h. The violet color is due to crystal violet, a compound that binds intracellular DNA and protein, thus highlighting the cells attached to the plate. Representative image of three independent experiments. (F) Quantification of colony formation assays of cells described in E, presented as the mean density (percentage of area occupancy) ± SEM of three independent experiments. NS, P > 0.05; *, P < 0.05; ****, P < 0.0001 by Dunnett’s test. (G) Western blotting of cells described in E. Representative image of three independent experiments.

