
Figure 2. Trajectories of Secondary Outcomes by Baseline Quintile of Ultraprocessed Food (UPF) Consumption .
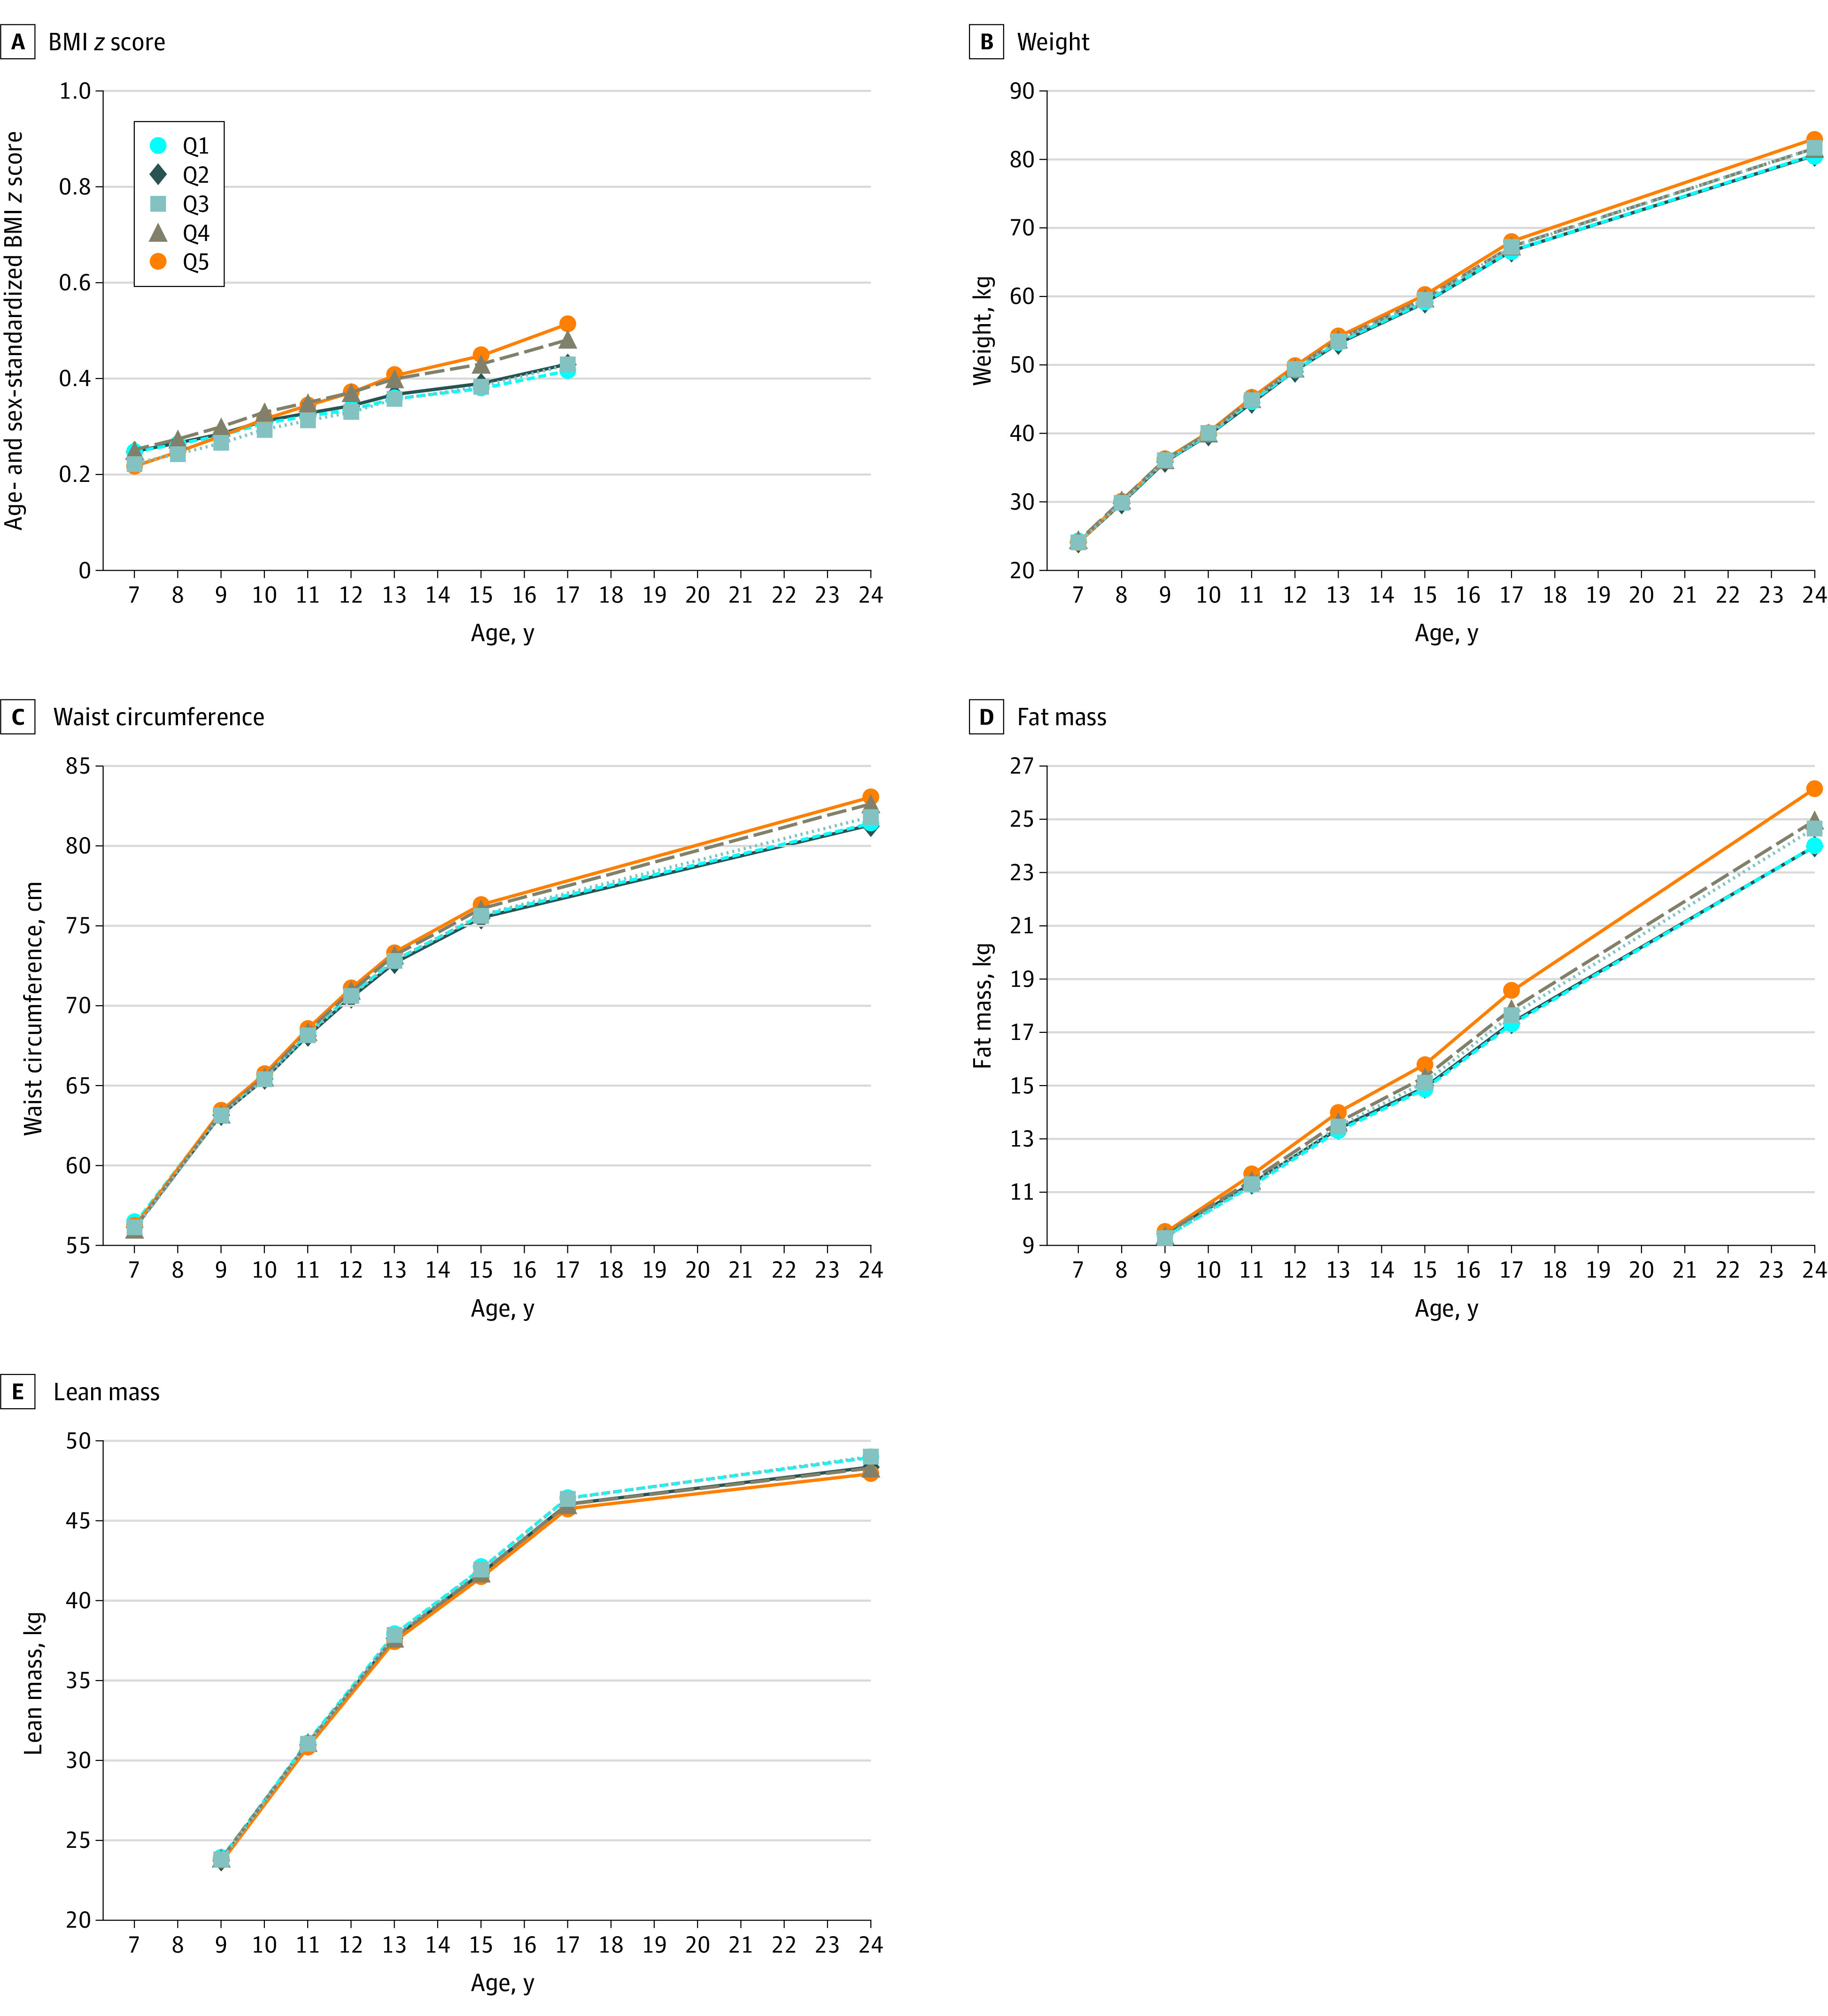
Data are from 9025 children who participated in the Avon Longitudinal Study of Parents and Children. Percentage of daily food intake contributed by UPFs at baseline was further categorized into quintiles (Q1-Q5, lowest to highest quintile of UPF consumption). Trajectories were plotted for the values estimated from the growth curve models at each age (wave) of clinic assessment. All linear growth models were fitted with individualized random intercept and random slope using age (and quadratic age for weight, waist circumference, and lean mass outcomes) as the underlying timescale and included baseline UPF quintile and an interaction term between age and baseline UPF quintile. Models were further adjusted for the child’s sex (male or female), race (White or non-White), birth weight (<2500, 2500-3999, or ≥4000 g), physical activity (moderate to vigorous physical activity per day ≥60 minutes or otherwise), quintiles of Index of Multiple Deprivation; the mother’s prepregnancy body mass index (BMI; calculated as weight in kilograms divided by height in square meters) (<18.5, 18.5-24.9, 25.0-29.9, or ≥30.0), marital status (single or married/living with partner), highest educational attainment (Certificate of Secondary Education or none, vocational, O level, A level, or degree or above), socioeconomic status based on UK National Statistics Socioeconomic Classification (higher managerial, administrative, and professional; intermediate; or routine and manual occupation); and the child’s total energy intake (continuous) at baseline. Baseline refers to BMI z score, weight, and waist circumference outcomes at 7 years of age and fat and lean mass and percentage of body fat outcomes at 9 years of age.