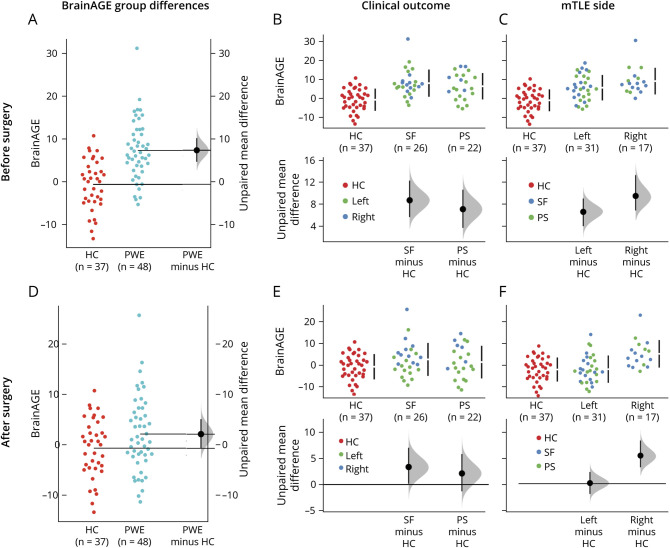
Figure 3. Between-Group Comparisons of Brain Age Gap Estimation (BrainAGE).
Comparisons of BrainAGE (computed as brain-predicted age minus actual age) for patients with epilepsy (PWE) and healthy controls (HC) (A, D), patients who are seizure-free (SF) and those with persistent seizures (PS) following surgery (B, E), and left- and right-sided mesial temporal lobe epilepsy (mTLE) (C, F). Comparisons are presented with BrainAGE values before (A–C) and after (D–F) surgery. In A and D, raw data points for BrainAGE in HC and PWE are shown in the left panel with unpaired group difference estimations plotted as a bootstrap sampling distribution (n = 5,000) (shaded area). Average effect size (mean difference) is depicted as a black dot and the 95% confidence interval (CI) indicated by the ends of the vertical error bar. In B, C, E, and F, raw data for patient subgroups are compared to HC (red) and plotted/color coded on the upper panel with associated estimation plots shown below. Note that where the 95% CIs (error bars) cross the horizontal line at zero, an effect size equal to zero is possible, i.e., no reliable difference from HC.

