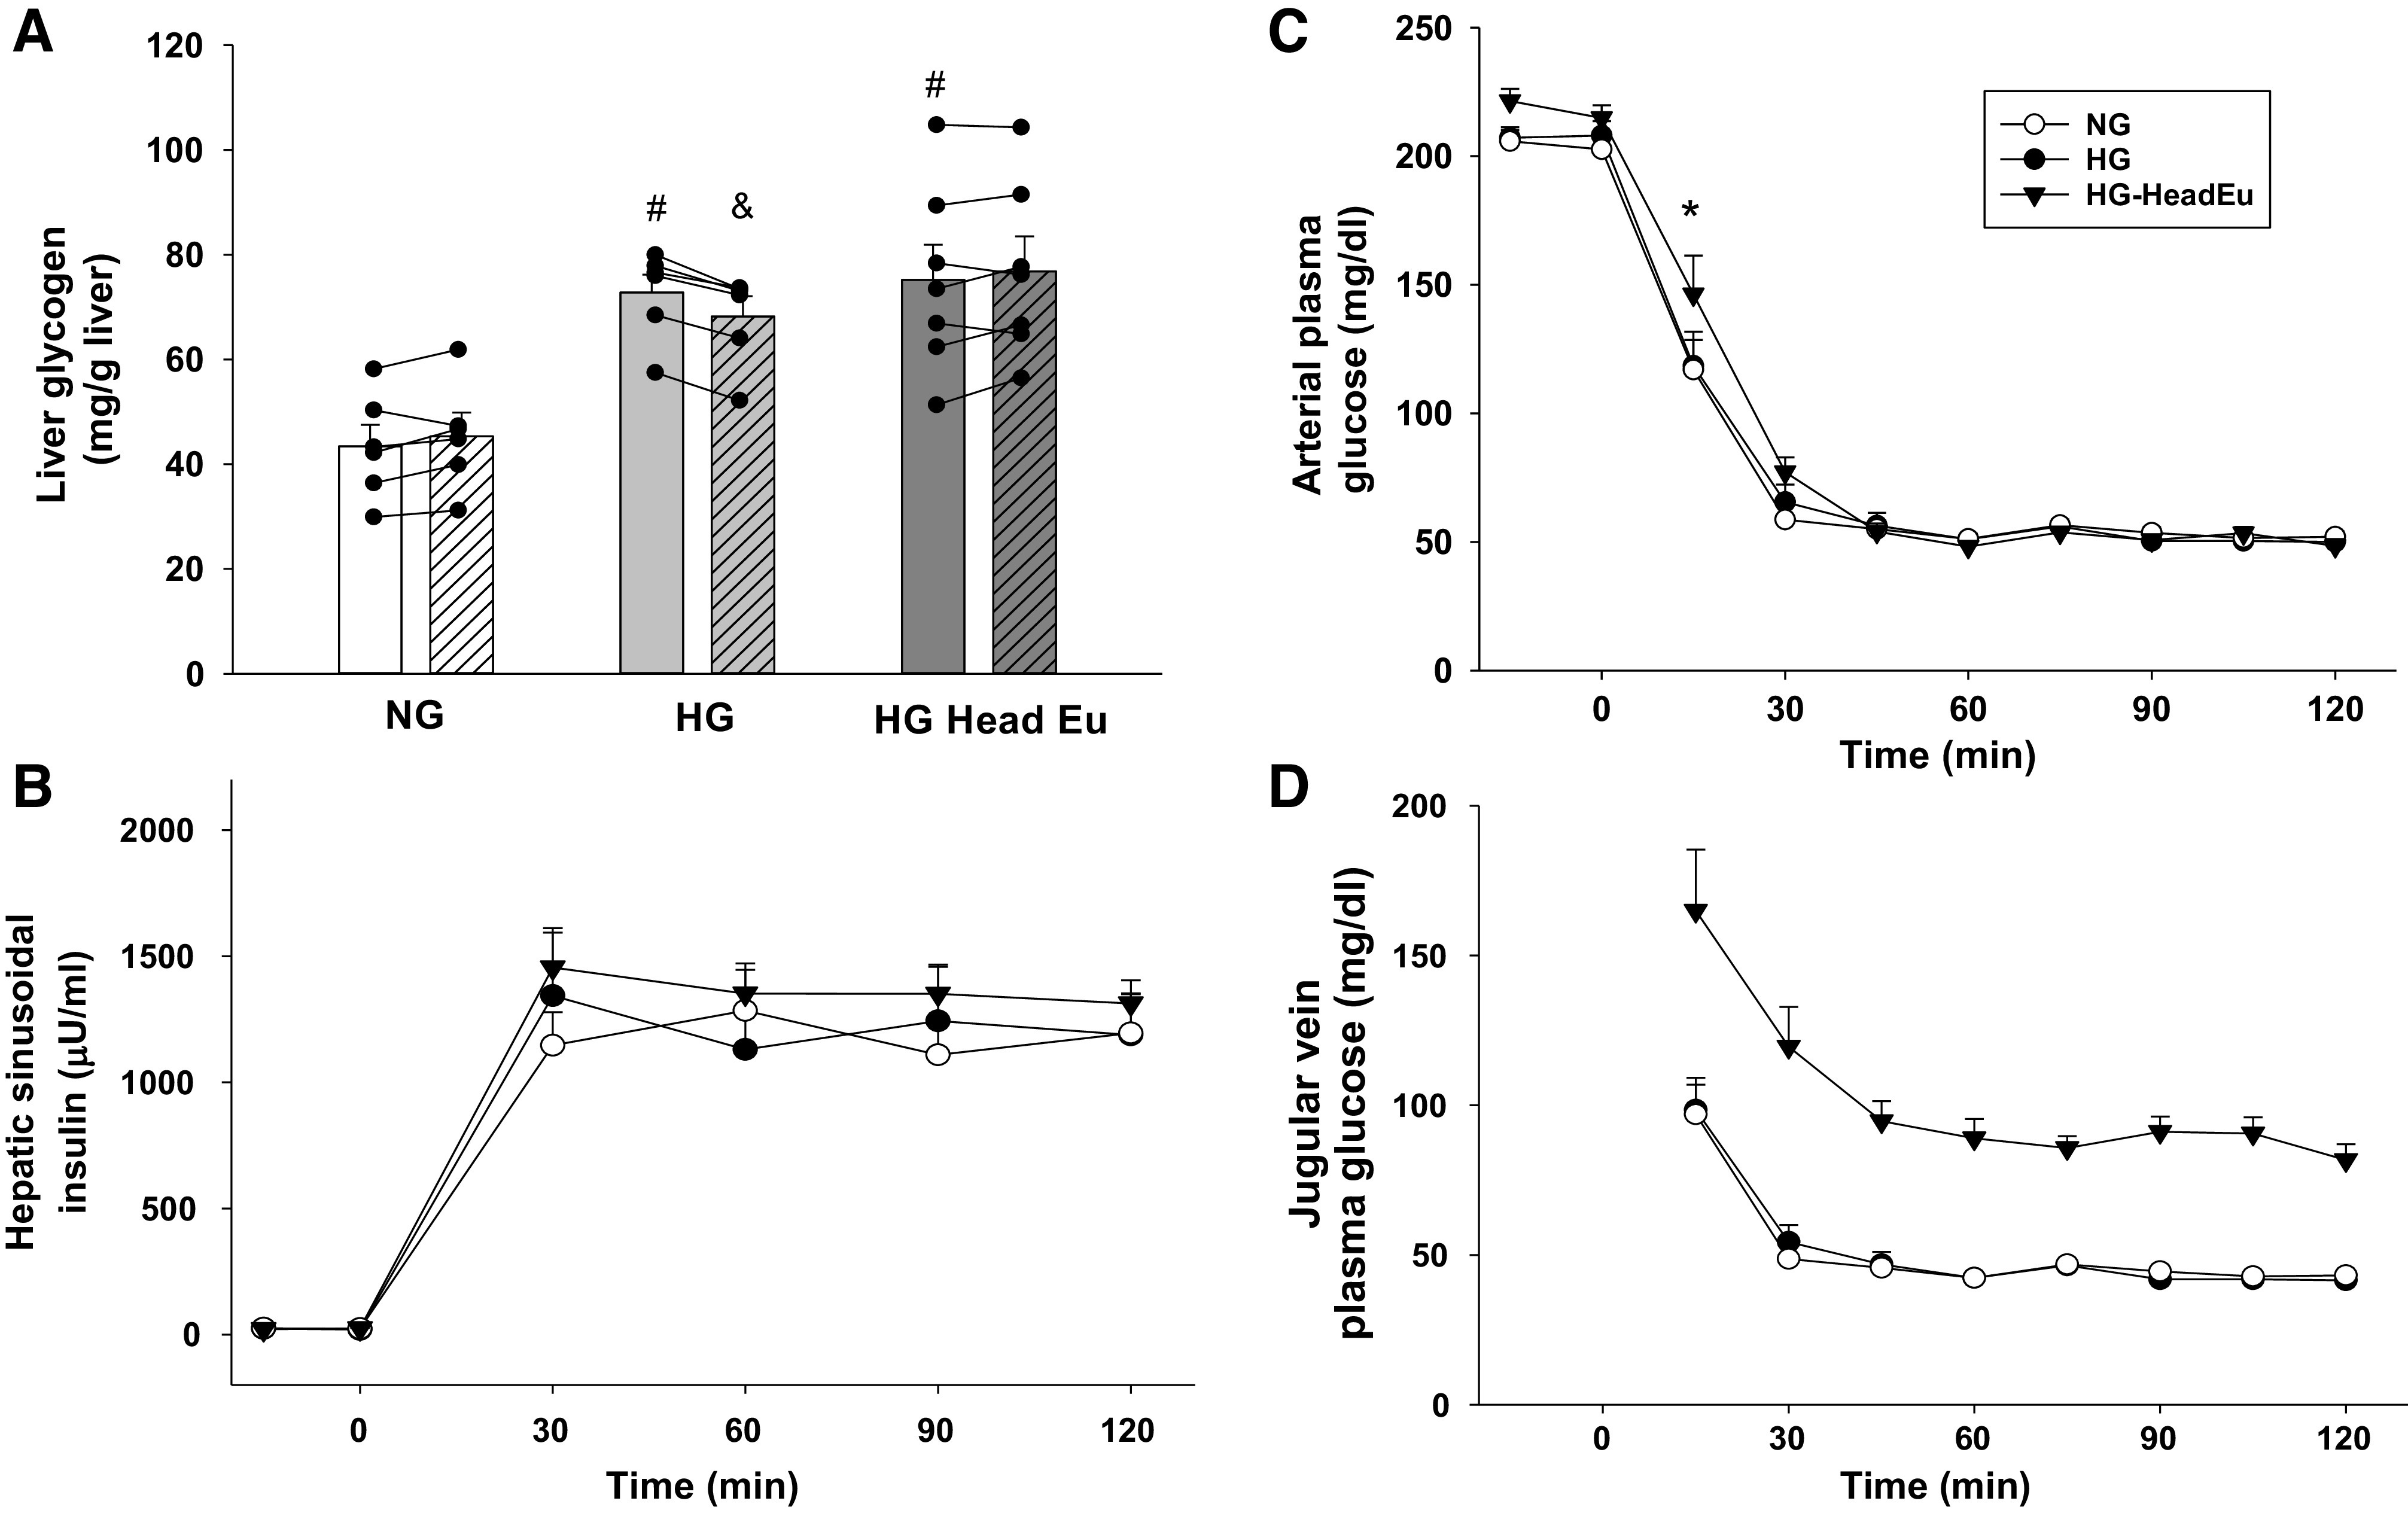
Figure 2.

Metabolic control during the hyperinsulinemic/hypoglycemic clamp studies. Prehypoglycemia (open bars) and posthypoglycemia (hatched bars) liver glycogen content (A), hepatic sinusoidal insulin levels (B), arterial plasma glucose levels (C), and jugular vein plasma glucose levels (D) during the experimental period. HG, intraportal (Po) infusion of fructose was used to stimulate hepatic glucose uptake; NG, saline was infused Po to maintain liver glycogen levels close to a normal, fasting level; HG-HeadEu, subset of HG group in which brain euglycemia was maintained by infusing glucose bilaterally into the carotid and vertebral arteries. *P < 0.05, HG-HeadEu compared with NG. #P < 0.05, compared with the same time point in NG. &P < 0.01, compared with the preexperimental value. Data were analyzed using two-way repeated measures ANOVA.
